Why the Service Leadership Index®?

The driving passion of Service Leadership is to enable Solution Provider (SP) owners to receive fair (high) value for their risk and the high value they deliver to vendors and end customers.

The Top Quartile SPs in each business model and in all geographies, earn about 3x the bottom line profit percent (EBITDA %) of their Median peers, regardless of their size, age, owner compensation, client profile or vendor selections. That is 3x the cash flow and 3x the stock value, doing essentially the same things for the same client profiles, regardless of geography. All SP owners should and can perform at this level.

While benchmarking necessarily looks at past performance, past performance is the best predictor of future performance and the only effective way to diagnose management skill and prescribe improvements. Financial benchmarking is the foundation for all likely, sustained improvements in financial performance of SPs. Without an objective comparison of financial performance, the likelihood of improving that performance is compromised.

Without the Service Leadership Index®, or something like it, strategy and tactics to improve profits and growth are to a material degree without foundation.

Industry Benchmark Reports

Annual Solution Provider Industry Profitability Report

200+ pages
$13,200

Indispensable decision-making information for Solution Provider owners, executives, investors and vendors.

Each year, thousands of Solution Providers worldwide, across all business models, participate in the S-L Index, making possible this indispensable decision-making information for Solution Provider owners, executives, investors and vendors.

Individual, Private Benchmark Reports

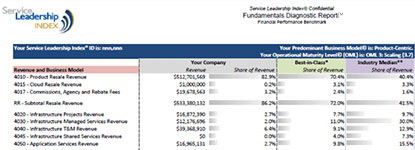
Fundamentals Diagnostic Report

Individual, Confidential Benchmark

Identify your partners’ financial and operational strengths and weaknesses, then plan or validate your course of action using this individual, private benchmark.

The Fundamentals Diagnostic Report (FDR) compares your partner’s company to the Top (Best-in-Class) in their specific business model and to Median performing firms across all SP/MSP/CSPs by examining 17 critical profitability metrics including gross margin by line of business; by sales, marketing, general and administrative costs; and by adjusted for fair market owner compensation.

The FDR also includes an Operational Maturity Level assessment and recommendations for progressing to Best-in-Class.

Volume discounts are available for Vendors seeking to engage a minimum number of partners and leverage the benchmark report by hosting an exclusive webinar review of the aggregate findings and recommendations for the benefit of participating partners and channel managers.

Service Leadership Index® Quarterly Benchmark Report

Expanded Confidential Benchmark with Tools
Updated Quarterly

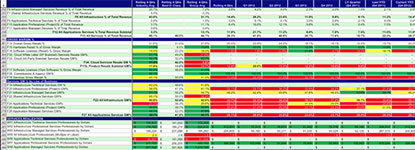
For Vendors or Solution Provider industry peer group facilitators seeking sustained progress and management insight for their partners or group members, this confidential benchmark report examines the 17 critical metrics of the Fundamentals Diagnostic Report, plus 68 more metrics for deep dive analysis and action.

Tools may includes the interactive Best-in-Class-o-Meter (based on Predominant Business Model) for easy "what-if" planning, as well as a basic Operational Maturity Level assessment and recommendations.

As a sponsor, each quarter you will receive the Service Leadership Index® Quarterly Benchmark Management Report, an aggregate of group member metrics including:

  • Key Metrics by Predominant Business Model (PBM) and Group
  • Adjusted EBITDA by Revenue size statics
  • Headcount by PBM and Group
  • Custom analytics available

Volume discounts available based on number of participating partners.

Follow US Contact Us