Each year, thousands of Solution Providers worldwide, across all business models, participate in the S-L Index™, making possible this indispensable decision-making information for Solution Provider owners, executives, investors and vendors.
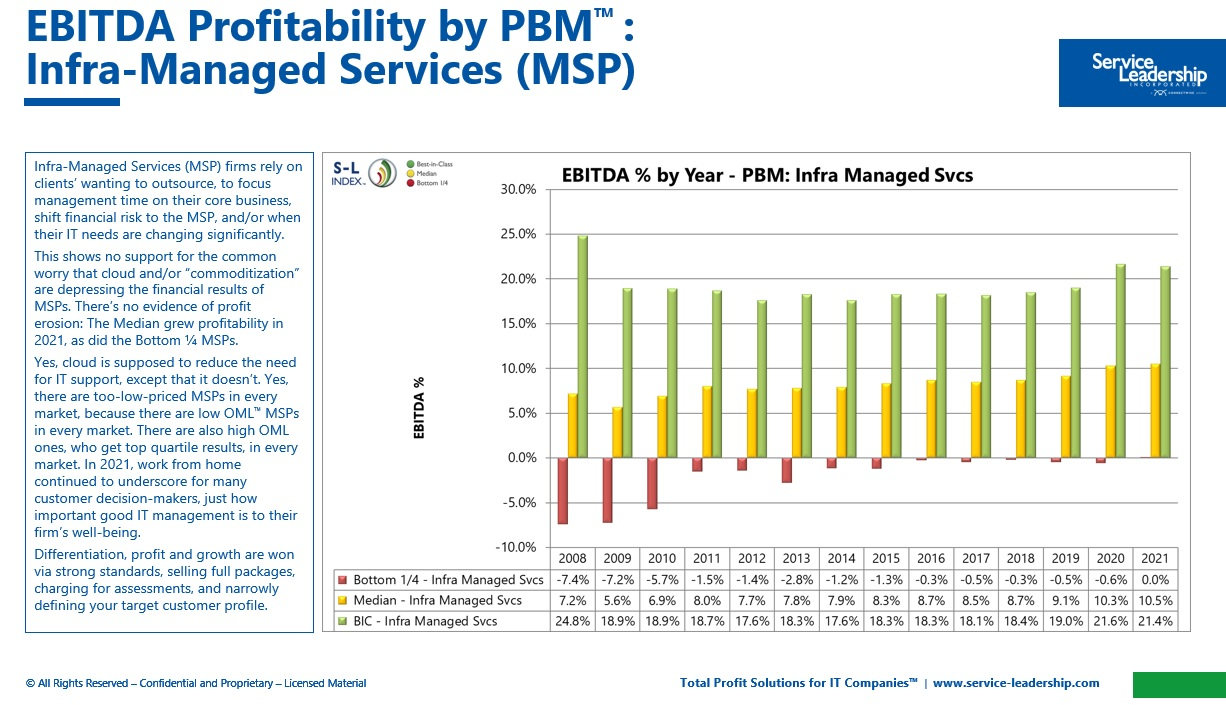
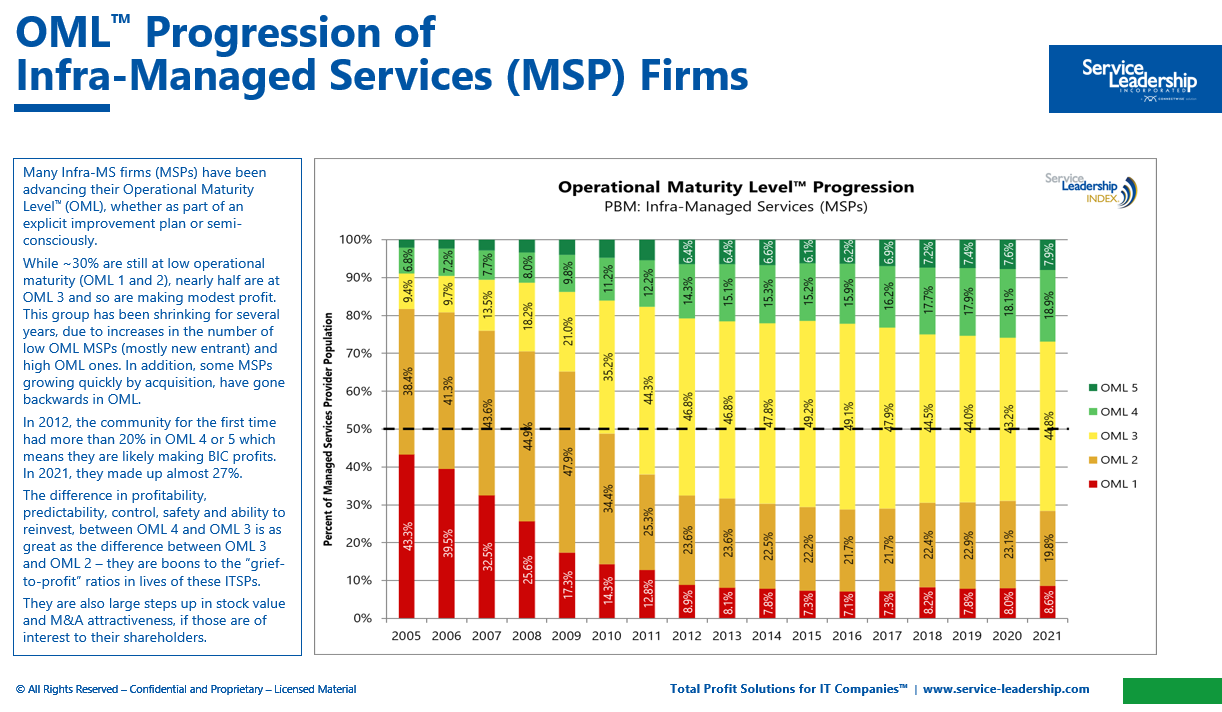
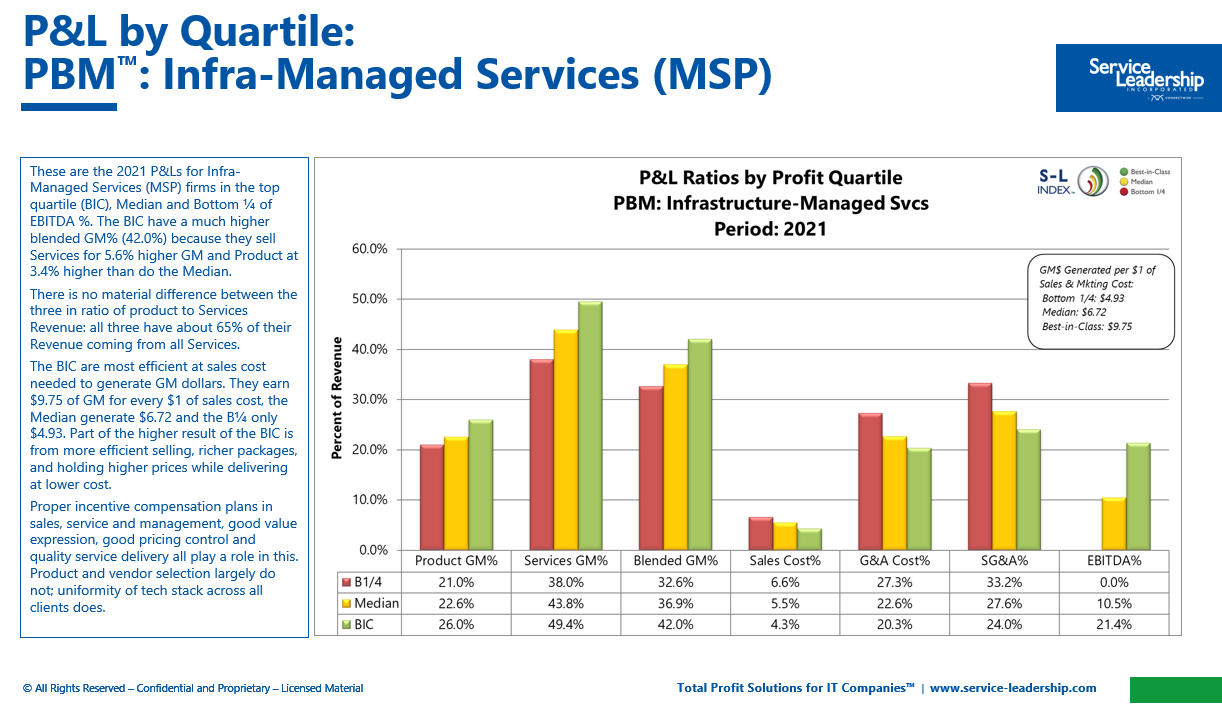
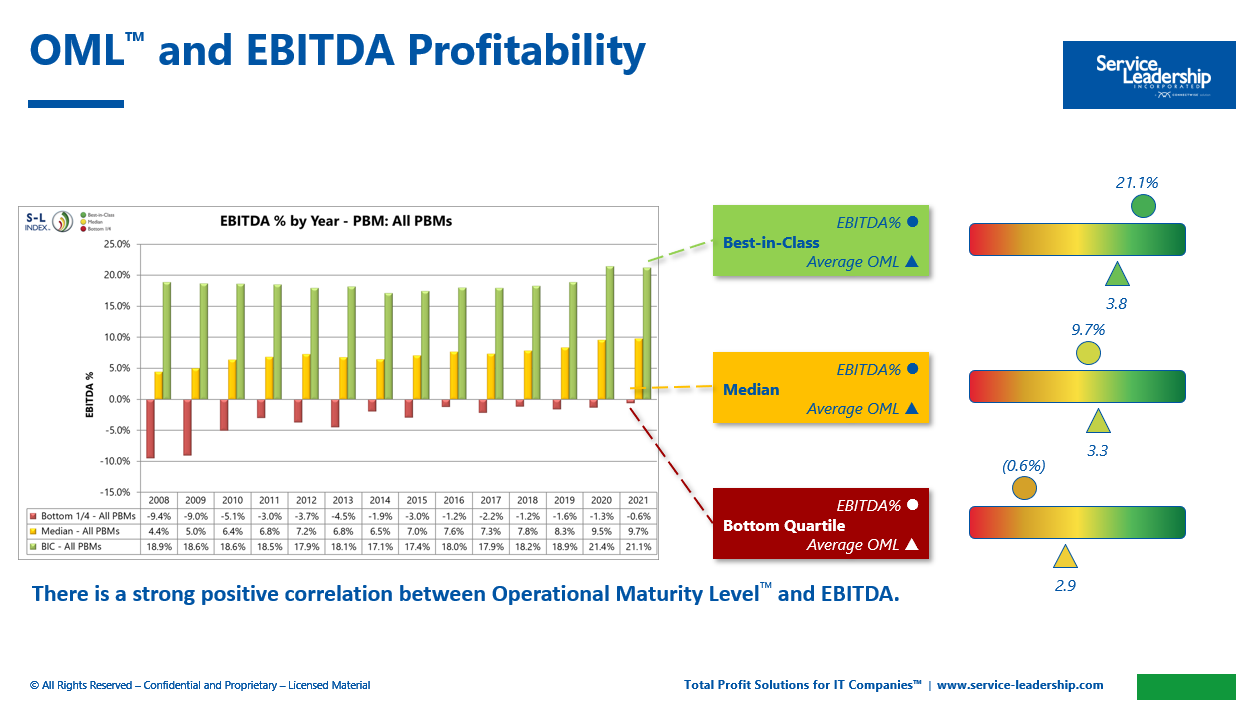
This report includes 70+ metrics including objective measures of financial performance and of Operational Maturity Level™.
- What is top performance for each Solution Provider business model, and how to determine how your offers help get partners there.
- Capitalize on the changes in the industry by seeing how partner business models are changing with our unmatched 11-year trending.
- Understand partner product resale and Services Gross Margins, as well the sales and administrative costs and performance.
- Understand how top-performing partner executives look at their businesses, and how to appeal to them.
View Table of Contents

