Considered to be the leading source for business intelligence about compensation strategies of IT solution providers (TSPs), this report provides data and analysis on:
- Compensation of sales, service, administrative, management, and owner positions common to TSPs.
- Headcount ratios between the various positions in both lower- and higher-performing TSPs.
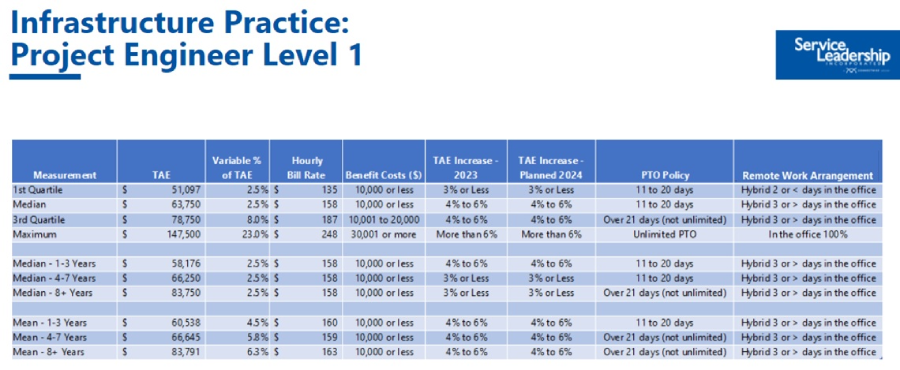
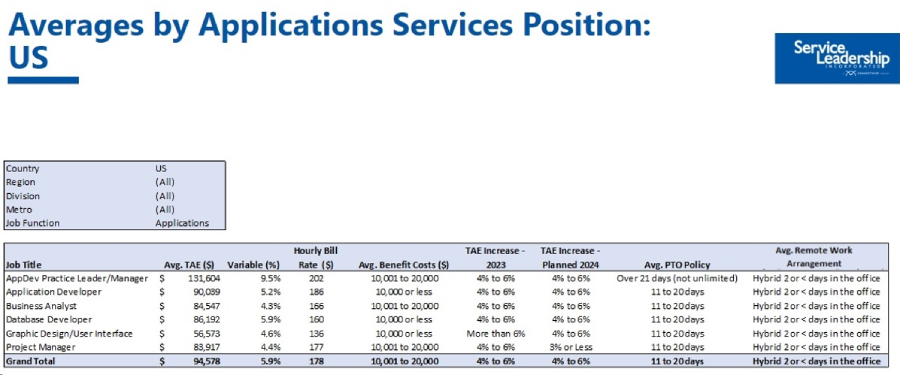
- Total annual earnings (TAE), variable % of TAE, hourly bill rate (for billable employees), and TAE increases in 2023 and planned for 2024 for 50+ TSP positions by:
- Geographic region
- City tier
- US and Canada metro area, and Europe and Australia/New Zealand at a national level
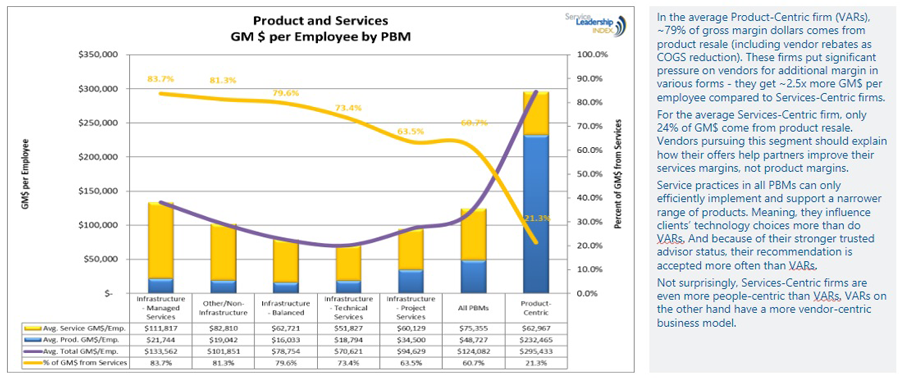
- Predominant Business Model™ including MSP and VAR
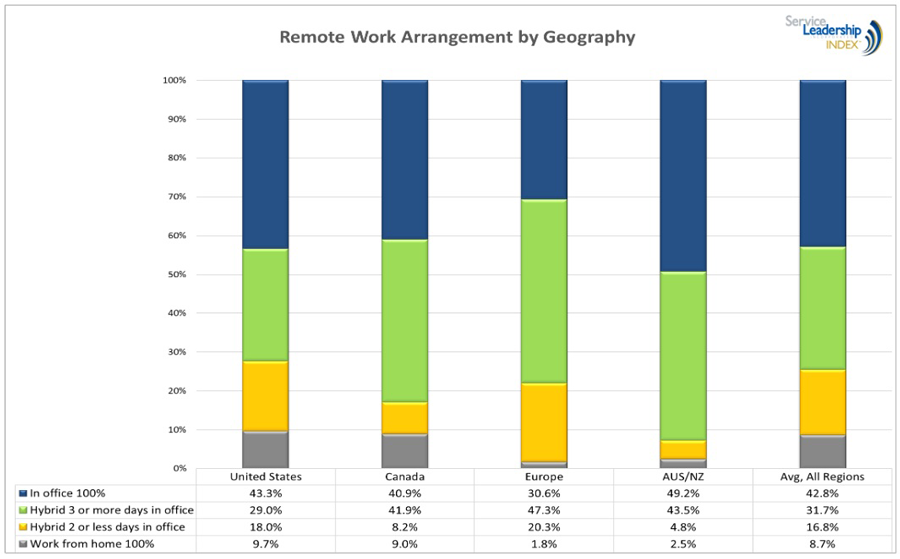
- Remote work arrangements: Which employees are back in the office 100% or working remote 100%
- Benefit costs, including paid time off (PTO) policy
Plus, compensation by practice/department with key metrics addressing each operational area of the company including G&A, managed services, sales and marketing, and owner compensation.
View Table of Contents
Download Executive Summary
BUY THE FULL REPORT