In 2019, we published the first version of “How to Successfully Raise Prices” and it went on to become one of our most used reference guides. Since that time, while many of the practices described remain the same, others have slightly changed and were in need of updating. In addition, many best practices in Managed Services price increases have solidified since 2019. As a result of this, “How to Successfully Raise Prices” has been updated to provide you with current data (as of 2022) and additional information to further help guide you on why, when, and how to raise prices, including ways to capture additional revenue and boost your services gross margin.
Raising Prices as Critical Part of Service Profitability
The most durable customer/supplier relationships – those with the highest value to both parties – are the ones which create a win/win business outcome for both parties. Ideally, your solutions and services help not only your client be more financially successful, but also even their clients.
Several cultural aspects of the IT services business conspire against win/win pricing: The technical people that deliver the service tend to be good Samaritan personalities; the salespeople do as well, and fear losing customers based on perceived cost; owners and executives of IT solution provider (TSP) companies can sometimes lack business acumen. And all three groups can lose business objectivity towards their customers due to long relationships and perceived loyalty. This newsletter provides best practices for maintaining win/win pricing in a TSP business.
The iron triangle of IT services business is the same in every IT company, everywhere in the world: rates, utilization and wages. There are thus two ways to increase services margin:
Increasing the revenue by:
Raise the amount charged per service,
Selling more services.
Reduce the cost of the labor involved by
Automating,
Hiring lower skilled (that is, lower paid) people,
Using process and technology to drive efficiency that reduces the number of labor hours per deliverable.
This newsletter also focuses on improving services margins by both raising rates (increasing revenue) and by reducing actual cost per hour, but with your existing people. We will also discuss best practices for raising prices on Managed Services offerings, including annual increases in multi-year agreements and what to do with clients under contract. The methods here apply to all TSPs, regardless of business model, geography, size or customer segment.
The Definition of Successfully Raising Prices
The definition of success in raising rates is to drive services revenue (including billable services and for Managed Services) to attain a Multiple of service of 2.5 times Taxable Wages1 or better on labor-based services (or 4.5 or better on your own Cloud services) and not lose any customers we didn't want to lose. Attaining this multiple will deliver at or near Best-in-Class services gross margin percent of 50%.
Price increases apply to both existing and new customers. To the extent they are applied only to new customers, or only to existing ones, your profit improvement will be sub-optimized.
Eliminating the anxiety you and your staff – especially your sales staff – may feel during the price increase process is not part of the definition of success. This anxiety is natural but, as you will happily find, unmerited.
Why Raise Prices?
Interestingly, the most profitable TSPs are typically also the fastest growing TSPs. This faster growth comes as a result of two factors:
More gross margin dollars available to be spent on Sales and Marketing, and
Service quality is high so existing customers are happier and likelier to renew. More importantly, salespeople are more excited to sell services to new customers because they are confident the customer's service experience will be good.
Attaining Best-in-Class bottom line profitability also helps ensure the stability, durability and future competitiveness of your company, which provides better services, customers, partners and employees alike. This is true during all economic cycles, but it is especially important during inflationary times.
Obsoleting Internal Objections to Raising Prices
Obviously, the most common internal objection to raising prices is that we will lose existing customers and have a harder time gaining new customers.
Both of these anxieties are groundless, as you will find when you raise prices.
There are three pricing methods used by TSPs, in this order as they learn to effectively run their businesses:
Market-based pricing: This is the most common first method used to set prices. It is chosen due to two false assumptions:
That one must be “at or near market” pricing to successfully compete, and
Competitors who are at market price are making money and doing a good job.
Cost-based pricing: After a period of losing money or not making acceptable profit because of using market-based pricing, the TSP resorts to cost-based pricing. Usually, the thought process is: “The other guys (who use market-based pricing) must be much more efficient than me because they can make a fair profit at those low prices. But regardless of that, I now know I can't make money at those prices, and I must take what I know my cost to be and double it, to make 50% gross margin.”
Again, the false assumption is that other guys are making money. It's important to remember that, as the Service Leadership Index® shows, in every market in every business in every geography, at any time, roughly one quarter of TSPs are losing money, and median profitability is only about 1/3rd the profit percent of that earned by the top quartile TSPs.
Moving to cost-based pricing usually results in prices about 2x to 3x the price set during the market-based pricing phase.
Value-based pricing: This is the pricing method most often used by the TSPs in the top quartile of profitability, in every business model and in every market. It reverses the pricing discussion from what the TSP is charging to what business costs and risks the customer faces if they keep doing IT as poorly as they are doing it. You know they are doing IT poorly, or expecting to do IT poorly, because they have agreed to talk with you.
Moving to value-based pricing generally results in prices about 50% higher than those attained in the cost-based pricing phase.
In your market and in your business model, the top quartile of TSPs earns about 2.5 times higher bottom line profit percentage, pursuing the same customers you do with the same offers. They use value-based pricing. They are likely growing faster as well.2 The objection that, “We'll win fewer deals,” is groundless.
The other objection is, “We will lose existing customers.” You likely will lose a few customers, generally less than 1% of your accounts. Most likely, the only ones you will lose are the ones which are already very low or negative profit. Everyone will be happy to see them go, because low profit customers are almost always also difficult to deal with on a number of levels.
We have raised prices in our own TSP companies many times and rarely lost a consequential customer. We have helped many, many clients raise prices, often a significant amount. Most of them believed they would have significant customer attrition, and all were greatly relieved to find they had almost none.
You cannot deliver consistent service quality without pricing at a value-based pricing level. You cannot offer pay increases much less career paths. You can't reinvest to stay competitive. If you want to build a business, you have to get to value-based pricing levels and learn how to qualify and sell there.
How Much Should You Raise Prices?
How much you should raise prices is of course determined by how far below proper pricing you are.
The Service Leadership Index will tell you what Best-in-Class services gross margins are for your specific business model, but for this discussion, across all business models, in all markets, we can go with 50%.
Real Life Case
One of our clients, who had not raised prices in eight years, finally did so (because she was losing money). After raising prices – during which she lost no customers of consequence – she was in a meeting of the Board of Directors of a non-profit. Also on the board was one of her most important customers, the CEO of a large company in town. He took the opportunity to tell her: “I'm glad to see you raised your prices. As a customer, I would never tell you to raise your prices, but I'm glad you finally did. I want to see you stay in business. Every other of my suppliers raises their prices every year, and so do I.”
That equates to revenue of about 2.5 times the Taxable Wages of the service team (including service management, pre-sales, service admin, post-sale account managers, etc.). If you have $1mm in service Taxable Wages in a given time period, you need $2.5mm in services revenue generated by that team, to be at about 50% gross margin.
It's important to note that this “multiple of wages” approach purposefully takes into account billable utilization without having to know what it is.
Meaning, it doesn't care if an engineer with a Taxable Wages of $100,000, attains $250,000 in revenue by billing 2,000 hours at $125/hour or by billing one hour at $250,000/hour!
As long as you get to 2.5 x Taxable Wages, you'll be at close to the targeted 50% gross margin. This calculation works whether your service team is five people, 50, 500 or 5,000 people. It works whether you are analyzing an individual engineer, a team, a location, a practice, your whole company, a proposal, or a contract.
The point is, no matter how you do it, if you want to attain top quartile bottom-line profitability, you need to get that $250,000 – or 2.5 x Taxable Wages – somehow. This newsletter describes how.
What's the Right Rate?
If your average engineer has a Taxable Wages of $100,000, and your average billed utilization is 1,500 hours per engineer, then to get to 2.5 x Taxable Wages, you must bill each of those 1,500 hours at $167.00/hour:
$100,000 / 1,500 = $67 x 2.5 = $167.50 / hour
This is true for services billed by time, and for the implicit rate “inside” flat fee/Managed Services agreements.
The crucial point here is that the denominator (number of hours assumed to be billed in a year by the resource (or class of resources) is accurate to what they're really going to bill (either to a client or a recurring revenue agreement with a client). We are using 1,500 hours in the example above; this may or may not be a correct assumption for you. The actual denominator you should use, should be determined by your actual billable history for the position, and your budget plans for the year.
If, for example, your actual denominator is 1,400 hours instead of 1,500, then your required rate for the position – to maintain 50% gross margin – would be $178.57/hour. If the actual denominator is, say, 1,600 hours, then the required rate would be $156.25/hour. Obviously, actual billed hours is the primary driver of cost per hour and thus of the required rate per hour.
Too often, TSPs at lower Operational Maturity Level™ (OML™), look at “market rates” and then consciously or semi-consciously, reverse-engineer their billed-hours denominator to arrive at that rate.
In effect, they “imagine” their billed hours for a given role will be, say, 1,700 hours (or worse, all hours worked in a year, that is, 2080 hours), and thus would in our example calculation, arrive at a rate of $147.05/hour. Unless they actually bill that role at 1,700 hour or higher, that $147/hour rate will result in gross margin below 50%. For example, if their actual billed hours is 1,400 (not 1,700), then using the $147/hour rate will actually produce a gross margin of about 30%.
Given that to maintain top performance, a service offering needs about 30% spent on Sales, General and Administration for every dollar of services revenue, that 30% gross margin results in a zero net income service offering.
The false assumption is that most others in the marketplace are making money at – in this example - $147/hour rate. They are not. From the Service Leadership Index, we know that roughly one quarter of TSPs in your business model, in all markets, lose money. On the other side of the equation, one quarter perform extremely well, making about 2.5 times higher bottom line profit percent than the Median. In virtually all cases, these top quartile TSPs are charging materially more for their offerings, in the same market, targeting the same customer profile. Usually, they're charging at least two times as much as the Median TSPs.
At this point it may also be helpful to know that this method applies equally well to all TSP business models in all markets:
TSPs in Tier 4 (low population) markets often envy the supposed profit-making capacity of their peers in Tier 1 (large population) markets because, “They can charge so much more.”
Meanwhile, their peers in Tier 1 markets often envy the supposed profit-making advantages of being in a Tier 4 market because, “You can pay so much less.”
In fact, the rates attained by the Best-in-Class firms in Tier 4 and Tier 1 markets don't differ very much, and wages differ even less. However, in the limited cases when there is market variation in wages, it is even more important to apply the 2.5x rule by pricing services even higher to account for it.
First, How Far Have You Fallen Behind?
One way that TSPs find themselves at too-low rates is through lack of raising prices often enough. As we noted in the real-life case above, sometimes this can slip to years elapsing between increases.
As a first step, increase your rates at least as much as you are worried the market will bear, but no less than the Consumer Price Index (CPI) increase for each year since you last increased your published rates.
The CPI for the most recent years is shown below:
Year
December CPI*
%Change from Previous Year
Cumulative Since 2000
Parity with $125/hr in 2000
2022
296.8
6.5%
70.6%
$213
2021
278.8
7.0%
60.2%
$200
2020
260.5
1.4%
49.7%
$187
2019
257.0
2.3%
47.7%
$185
2018
251.1
1.9%
44.3%
$180
2017
246.5
2.1%
41.7%
$177
2016
241.4
2.1%
38.8%
$173
2015
236.5
0.7%
35.9%
$170
2014
234.8
0.8%
34.9%
$169
2013
233.0
1.5%
33.9%
$167
2012
229.6
1.7%
32.0%
$165
2011
225.7
3.0%
29.7%
$162
2010
219.2
1.5%
26.0%
$157
2009
215.9
2.7%
24.1%
$155
2008
210.2
0.1%
20.8%
$151
2007
210.0
4.1%
20.7%
$151
2006
201.8
2.5%
16.0%
$145
2005
196.8
3.4%
13.1%
$141
2004
190.3
3.3%
9.4%
$137
2003
184.3
1.9%
5.9%
$132
2002
180.9
2.4%
4.0%
$130
2001
176.7
1.6%
1.6%
$127
2000
174.0
$125
Source: U.S. Bureau of Labor Statistics via www.inflationdata.com
The Bureau of Labor Statistics uses 1982 as the baseline of 100, so as of 2022, inflation since that year has been 197%.
As the table shows, if in 2010 your rate (whether explicitly charged or implicit in your flat fee services) was $157/hour, you needed to be at $213/hour in 2022 to be at parity with 2000's rates.
Using this table as a reference, if your last rate increase was, say, in 2012, to $150/hour, then in 2022 you needed to be at $194/hour to be at parity with 2012. Costs don't creep up – they race. As you know, IT costs go up faster than the general economy.
Bear in mind it isn't just payroll costs that get pushed up – virtually all your suppliers increase their fees each year, one way or another. (If they don't, beware; they're going out of business.)
It's pretty hard for customers or sales reps to argue with merely keeping up inflation; the majority of customers regularly raises their own prices as well. After all, they're paying for their own increases in employee wages, raw materials from suppliers, and more. Employee benefits are not slowing down their increases wither. So, customers are well acquainted with price increases, they're increasing their prices to their customers each year. If they're not, reconsider doing business with them.
If you're long overdue for a rate increase, it is likely not at all difficult to do, from a competitive standpoint. Ask your new hires what their former companies charge. Ask your vendors what your competitors charge. Ask prospective customers what competitors charge. Then decide where you need to be, regardless of competition, to be at 2.5x of your service wages.
If your task is this simple, then all that's left is convincing your people. This can be accomplished by giving an order and moving forward. You will have to put up with considerable noise, but you will have a successful initiative per our definition above.
Keeping Score
Raising your rate from your 2010 rate of $125/hour to keep pace with 2022's CPI means increasing it to $169/hour, with the most straightforward justifications possible, discussed above.
What impact will this have on your gross margin and bottom line? The table below shows it will be material:
Actual Realized Rate/Hour
Tactic
COGS Rate in 2022*
Rate/Hour
Step Increase
GM%
%Rate Increase
$/Hr Added to Rate
Cumulative
BIC** SG&A (24%)
Bottom Line
Start (2010 Rate/Hour)
$100.00
$125.00
20.0%
24%
-4.0%
Raise Rate to 2022 CPI (35.4%)
$100.00
$169.25
35.4%
40.9%
35.4%
$44.25
$44.25
24%
16.9%
*Engineer at $120,000 Taxable Wages in 2010 and 2022, billing 1,500 hours to clients, to contracts or to both. $120,000 x 2.5 = $300,000 ÷1,500 = $200/hour @ 50% GM = $100.00/hour COGS.
**BIC: “Best-in-Class” – The average SG&A for a services business unit delivering top quartile Net Operating Income percent.
With this one action, we are already approaching the threshold to get into the top quartile, of 17.8% bottom line3.
Your gross margin on service has increased over 21%, and your bottom line on service has increased by nearly the same. Will sales cost have increased slightly due to higher commission paid on a higher margin deal? Yes, but not much, and we'll keep things simple here.
Second, What About Discounting?
Discounting occurs in a number of ways, and they can be perniciously hard to control, due to:
The partial truth that's it's better to close a deal at a lower price than to not close it all.
The damage done by discounting not being correctly understood.
Discounts being taken in ways that senior management doesn't see, or turns a blind eye to.
Incentive plans which don't fence off unapproved discounts, so sellers get paid even when they break the implicit or explicit rules.
Discounting can be incorrectly viewed as a necessary and low-cost way to get customers to commit to multi-year Managed Services agreements.
What's Your Targeted Gross Margin?
It is better to close a discounted deal than no deal at all – but only down to the level of your targeted margin. What is that targeted margin? More from the Service Leadership Index.4
Result
Product-Centric
Services-Centric
BIC GM%
32.5%
40.9%
BIC SG&A%
19.0%
23.8%
BIC EBITDA%
15.9%
19.5%
Source: Service Leadership Index 2022 Annual Solution Provider Industry Profitability Report
“BIC” in the last row means “Best-in-Class” which is what we call top quartile EBITDA (bottom line) percentage results. “BIC” in the other two rows means the average attained by those in BIC EBITDA%.
This means that if you want to attain top quartile or BIC EBITDA %, and you are in a Services-Centric business model (that is, more than 40% of your top-line revenue comes from services, your people and systems deliver), then your target for blended gross margin (all products and services included) needs to be at least 40.9%. Of this, your services margin needs to be at about 50%, or about 2.5 x Taxable Wages of everyone on your services team (i.e. individual contributors and management).
If your business model is Product-Centric (that is, revenue from services delivered by your people and systems is less than 40% of your total revenue), then to attain BIC EBITDA % for the business model, your target for blended gross margin needs to be about 32.5%, of which, your services margin needs to be at about 42% or about 2.4 x Taxable Wages. While 2.4 x Taxable Wages is slightly lower than the 2.5 x needed for Services-Centric businesses, it is prudent to use the 2.5 x target as the objective as a Product-Centric firm because a)as TSPs all become more operationally effective, this number has trended upwards and likely will soon reach 2.5 x and b)reaching 2.5 x will provide even better Gross Margin.
The Effects of Discounting
Salespeople and others on the front line, often feel pressure to discount – as often reflexive as customer-requested. In addition, many TSPs offer a standard contract length of one-year and offer discounts for customers willing to commit to two or three year contracts. In doing so, they believe that the extended length of the contract will justify the discounts, which are perceived by the TSP as immaterial. Unfortunately, these well-intentioned people are often under-educated about the impact of discounting on gross margin. Let's clear that up. The table below shows the impact on gross margin dollars – remember, you can't pay bills with a % - of discounting by given amounts:
The Discount Produces a Decrease in Revenue of:
At 50% GM
At 45% GM
At 40% GM
At 35% GM
At 30% GM
Results in a Decrease in GM$ of:
5%
10%
11%
13%
14%
17%
10%
20%
22%
25%
29%
33%
15%
30%
33%
38%
43%
50%
20%
40%
44%
50%
57%
67%
25%
50%
56%
63%
71%
83%
30%
60%
67%
75%
86%
100%
35%
70%
78%
88%
100%
117%
40%
80%
89%
100%
114%
133%
45%
90%
100%
113%
129%
150%
50%
100%
111%
125%
143%
167%
The table above shows that if we take a deal that is quoted at 50% gross margin, and discount it by a seemingly “harmless” 5%, we experience a decrease of 10% in gross margin dollars. In real terms, it looks like this:
Service deal quoted at $20,000, with COGS of $10,000 = 50% gross margin and $10,000 gross margin dollars.
Discount it by 5% to get it sold = $19,000 selling price.
Gross margin dollars drop by $1,000 or 10.0% of the original $10,000 gross margin dollars.
The situation gets worse when the original quoted price is at, say, 40% gross margin:
Service deal has same COGS of $10,000, but first quoted at 40% gross margin or $16,666, of which $6,666 is gross margin.
Discount it by 5% to get it sold = $15,832 selling price.
Gross margin dollars drop by $834 or 12.5% of the original $6,666 gross margin dollars.
As the original quoted price gets lower, giving the 5% discount on it, equates to larger and larger shares of the remaining gross margin dollars. If the original deal is quoted at 30% gross margin, and you allow a 5% discount, then you experience a 17% drop in gross margin dollars!
Remember, you can only pay SG&A with gross margin dollars, not percent.
How do the Best-in-Class deal with this?
First, they allow no or almost no discounts, and if they do, they do so by lower percentages. They have stricter controls, do not allow sellers to pit one approving manager against another, and set realistic floors on margin below which no commission gets paid.
Second, they start with higher quoted gross margin percentages. See “Valued-Based Pricing” above.
Third, to the extent that they respond to RFPs and similar bid solicitation vehicles, they are good at “unhooking” them so they can quote differentiated solutions…and higher prices.
Fourth, those that are interested in multi-year contracts, start with the assumption that the longer term is the contract length and all pricing is based on it. When customers insist on shorter agreements, they may be willing to provide them but only after adding additional cost to offset the risk of the customer not staying with them as long. This approach is the opposite of discounting.
Note the choice of words in the first bullet: Not “reduced commission”, but “no commission”. There's a difference between those two policies in resulting behavior and profit outcomes.
Some executives feel that simply reducing commissions on low margin deals will sufficiently discourage sales reps from discounting.
It doesn't work, because virtually all sales reps will take a smaller share of something, than a bigger share of nothing; they will discount as allowed to close the deal.
Only by not paying at all when the discount takes you below your target margin, can you effectively discourage discounting. Interestingly, once you set this policy in place, the majority of sales reps will figure out how to sell above the new floor, and within about six months, they'll forget they were even selling at lower prices. This is how the top-performing companies in every market, accomplish this.
Putting Successful Policies in Place
To a significant degree, this means just saying “No.” Those on your team involved in the sales process look for discounts to close deals because it is the path of least resistance. You should know there are competing TSPs in your market who hold rates higher than market, who do little or no discounting. 5
They have a culture in which their people know that asking for a discount will never be successful, and so they don't ask. They communicate the same to their prospective customers, by their body language, the way they steer their sales conversations, everything. They sell on value, not on price. You know when you walk into a street bazaar, you're going to negotiate. You know when you walk into Nordstrom, you're likely not. Which profit model would you rather own?
To help you with learning the “just say no” discipline, you might try setting boundaries or thresholds. For example, you might allow yourself one discount per sales rep per month. Or you might not allow discounts for services deals below $10k, 2.5% for deals between $10k and $25k, 5% for deals between $25k and $50k, and so on with a similar concept applied to Managed Services agreements (but be careful about straight lining this).
If you're short on manpower, you might grant a discount for signing now but starting later. If you've got excess capacity in your team, you might grant a discount for starting the engagement sooner. When you do this for Managed Services agreements, discounts that expire will lead in short order to fully priced offerings and are preferable to discounts that apply over the full length of the contract. For example, if a customers agrees to start the engagment sooner, if you add a discount that expires after the first year on a three-year contract, by year two the customer will be at full price. Not only will that increase the value of that contract in years two and three, but it will lower the delta needed to adjust the contract to current full price at renewal time, after year three. If discounts last the length of the contract, they will be more difficult to fully eliminate at renewal.
In no case, should the discount result in the realized rate for the engagement being more than 10% less than your published rate. But always have a reason that is a rule, not simply “We have to do this to get the deal.”
Keeping Score
Let's say your typical discount is 15%, and let's say you grant discounts on half of your engagements. That means the average engagement is discounted about 7.5%. If new engagements make up 75% of your revenue, then all your engagements are effectively discounted 5.625%.
Using the “just say no” and “hurdle or threshold” techniques, you now cut that to, say, an average of a 7.5% discount on one quarter of your deals. This means each new engagement is discounted about 1.875%, and across all your engagements you've granted a total discount of about 0.47%, just less than ½ of one percent. You've gained about 5% in terms of actual realized rate.
Let's update our price increase score:
Actual Realized Rate/Hour
Tactic
COGS Rate in 2022*
Rate/Hour
Step Increase
GM%
%Rate Increase
$/Hr Added to Rate
Cumulative
BIC** SG&A (24%)
Bottom Line
Start (2010 Rate/Hour)
$100.00
$125.00
20.0%
24%
-4.0%
Raise Rate to 2022 CPI (35.4%)
$100.00
$169.25
35.4%
40.9%
35.4%
$44.25
$44.25
24%
16.9%
Minimizing Sales Discounts (5%)
$100.00
$177.71
5.0%
43.7%
42.2%
$8.46
$52.71
24%
19.7%
* Engineer at $120,000 Taxable Wages in 2010 and 2022, billing 1,500 hours to clients, to contracts or to both. $120,000 x 2.5 = $300,000 ÷1,500 = $200/hour @ 50% GM = $100.00/hour COGS. **BIC: “Best-in-Class” – The average SG&A for a services business unit delivering top quartile Net Operating Income percent.
We have now exceeded the bottom line profit percent threshold (19.5%) to be categorized as Best-in-Class. Remember that this is simply the threshold to get into the top quartile.
Third, Free Labor Due to Mistakes, “Be-Backs” or Poor Scope Control
The cost of unbilled re-work, and or work given away for free, can be material.
Free Re-Work and Be-Backs
Your team may be doing poor work because there's too little time to plan and work appropriately, which is often a result of having too few gross margin dollars to allow the team the time to do these things properly.
Closely associated are “be-backs,” which are return visits needed not because we did the work wrong to begin with, but because either we didn't bring what we needed to do the work right the first time, or we failed to make sure the client was prepared for us to do the work.
Charging higher prices – and especially charging for assessments (another habit of the Best-in-Class) – will cure these in a relatively short time; if enough gross margin dollars flow through, you'll bring on more resources to meet the work of doing great assessments, design, plans and project management.
Better service quality gets more referrals and more confident sales reps, creating a virtuous circle of growth.
A compensation plan (or at least a recognition system) for service people which rewards bringing projects in on budget (including paid change orders) will also produce good results.
Scope Control
A bigger demon is poor scope control.
First, the deal must be scoped correctly. This means those who approve scopes must: a) know enough to know whether the scope is accurate and b) have an iron will to make a decent profit. This means approvals come from either the principal or a manager/lead who has a smaller base pay and a larger bonus tied to actual service department profitability.
Second, it's essential to have the discipline to apply the change order process to every engagement. Any work done outside of scope must be additionally charged for, not only by verbal agreement but documented in some form (former change order or even just an e-mail).
Another method of managing scopes is to pay salespeople additional commission on gross margins above a baseline of, say, 45% gross margin. This is the positive (obverse) side of not paying commissions below a certain gross margin threshold.
Getting Scope-Based Pricing Back Under Control
A common challenge in IT services is that your scoping process can be underestimating the hours and/or skills needed. There are a number of reasons behind this:
Poorly done (because unpaid) assessments;
Misguided Service management feeling price pressure;
Poor design;
Unsupervised collusion between the sales rep and whomever in service is doing the scoping in order to get an “acceptable” price, planning and project management practices;
Not conducting project “Post Mortems” to review anticipated vs. actual/realized gross margins.
And so on.
However, in taking action on these items to improve realized services gross margins, how do we best understand the extent to which we are off, and how do we track our progress towards the target gross margin?
The answer is, by using a services gross margin tracking sheet, similar to the one below. The sample below is for Professional (Project) Services but the same approach works well with recurring, flat fee Managed Services, as well. (For detailed information on how the services gross margin tracking sheet works, see Appendix.)
No Unmanaged Projects
Lastly, it is important to avoid selling projects without project management. All projects, no matter how big or small, need a discrete project management overlay (which is billed). This should equate to 10% of engineering hours for larger projects, and 15% for smaller projects, and the project management work should be done by someone chartered with project management responsibility, not the delivery engineer(s).
There is no lower limit to the size of project that merits project management; no matter how small, this should be included and charged, either overtly or included within the overall price at 50% gross margin. If it has a task list or scope of work, it's a project. Don't let that definition mislead you into re-defining small projects as something other than projects.
The challenge with even very small projects being unmanaged, is that when they go wrong – and they do, too often – you have compromised the client relationship and/or the sales reps' confidence in your ability to execute and engineers' job satisfaction. A small deal can compromise a larger relationship.
The mantra is simple: “We don't do unmanaged projects.” Consider: Would you trust the service department of a car dealer, which didn't have management? You expect, for the price quoted, soneone will be making sure the automotive techs do what they're supposed to do. Why would IT be any different?
Keeping Score
In general, free re-work, be-backs and poor scope control waste between 5% and 10% of a poorly-Managed Services team's billable time. If we assume the lower amount, then we can expect to recover about 5% in or 75 additional billed hours per engineer per year. This actually goes to reducing the effective COGS rate by about 4% to $84/hour, yielding this improvement:
Actual Realized Rate/Hour
Tactic
COGS Rate in 2022*
Rate/Hour
Step Increase
GM%
%Rate Increase
$/Hr Added to Rate
Cumulative
BIC** SG&A (24%)
Bottom Line
Start (2010 Rate/Hour)
$100.00
$125.00
20.0%
24%
-4.0%
Raise Rate to 2022 CPI (35.4%)
$100.00
$169.25
35.4%
40.9%
35.4%
$44.25
$44.25
24%
16.9%
Minimizing Sales Discounts (5%)
$100.00
$177.71
5.0%
43.7%
42.2%
$8.46
$52.71
24%
19.7%
Minimizing Free Work (5% Billability)
$95.00
$177.71
0.0%
46.5%
42.2%
$0.00
$52.71
24%
22.5%
* Engineer at $120,000 Taxable Wages in 2010 and 2022, billing 1,500 hours to clients, to contracts or to both. $120,000 x 2.5 = $300,000 ÷1,500 = $200/hour @ 50% GM = $100.00/hour COGS. **BIC: “Best-in-Class” – The average SG&A for a services business unit delivering top quartile Net Operating Income percent.
Fourth, Unbilled Travel Time
Unbilled travel time is the bane of the low OML TSP's existence, especially for SMB-focused ones. While enterprise TSPs must withstand their customers' greater ability to price shop, they can at least enjoy the much smaller travel time component that comes with larger and longer engagements.
Thankfully, the advent of affordable remote monitoring and management (RMM) tools, properly used, and the transition to more cloud-based infrastructure have reduced the travel time requirement in all shops significantly. In addition, the 2020 pandemic-induced transition to hybrid and fully-remote workers also reduced travel time for most TSPs, and that transition has continued. Nonetheless, many TSPs still fail to manage travel time to a win/win outcome.
And a win/win it should be, because the cost is significant.
Best-in-Class billable utilization for a field dispatch team is 65% vs. 75% for a project team and 85% for a centralized Network Operations Center (NOC) team. If the NOC team is running at 2.5 x Taxable Wages6 that means the field team is running at about 2.0 x Taxable Wages, or at about breakeven. Put another way, your field work is at an automatic 20% discount.
It's not unusual, in a low OML shop, for as much as 10% of total “billed” hours to be lost in unrecovered (unbilled) travel time. Anything we can do here to reduce travel time or improve revenue capture will drop immediately to the bottom line.
Change (or start enforcing) your travel time billing policies. There are as many different travel time policies as there are TSPs, but here we can list the most common approaches. You're welcome to apply more than one of them in your policy.
Minimum hours per trip – This is probably the simplest approach and encourages the customer to bunch work together for you. Generally, a minimum charge of two hours is a fair number, within your 30 minute (15 minutes each way) travel time perimeter. This means your effective rate for a minimum two hour visit is discounted “only” 25%; that's still a large discount. Outside of your 30 minute travel perimeter, use a four or eight hour minimum. Four hours is not optimal because there are additional inefficiencies – primarily a dramatically reduced ability to do enough calls in one day and a reduced response time to good (nearby) customers – that makes an eight hour minimum more of a win/win outcome for you and your client.
Trip charge – This is a flat fee applied to all visits. Again, this should vary based on your travel time perimeters: Perhaps $75 within your 30 minute perimeter, $150 within your 60 minute perimeter and $600 (essentially ½ day's billing) outside of that. Then, you charge your normal hourly rate. Since your perimeter is established by minutes of travel time (and not by miles), this policy produces no effective discount, provided you charge the equivalent of your normal hourly rate. Keep in mind the average speed of a metro-area trip (including freeway time) is 30 miles per hour. In other words, your 30 minute perimeter is probably a 15 mile radius. However, you must keep in mind local obstacles. For instance, is there a bridge that must be crossed where traffic backs up for hours each day?
Billing half-time for travel, or billing travel one-way – These are both ways to essentially bill the customer for whatever windshield time is incurred. While this is logical, it has two flaws. First, it starts out at a 50% discount. Second, it relies on your billable professionals to track their time very accurately, and on customers accepting the travel times reported. This method puts both people into detail-inspection mode which requires considerable management oversight.
Including travel time in your fully-managed offering with the exception of project work – The highest OML practice is to include trip charges and onsite time as inclusions within your fully-Managed Services offering. However, there are multiple caveats required for this to be executed properly. First, project work should always be excluded from this. Projects need to be individually scoped and the variation and individualisation required to perform top-quality work at Best-In-Class services gross margin. However, properly run service operations should be able to perform most other customer work remotely and should be able to build in an allocation for this work, including trip charges, into their pricing and do so with at least 50% services gross margin. One critical policy for this to be successful is the decision to send a tech onsite must always be made by a knowledgable dispatcher or service manager and the decision must be based on an inability to resolve the issue remotely. Customers will frequently request onsite techs for a variety of reasons and will especially do this if it is priced into their Managed Services offering. The decision to go onsite must never be based on customer request.
Keeping Score
Let's say that with your new travel expense policies, you are able to recover (bill for) just 2% of your “billed” hours:
Actual Realized Rate/Hour
Tactic
COGS Rate in 2022*
Rate/Hour
Step Increase
GM%
%Rate Increase
$/Hr Added to Rate
Cumulative
BIC** SG&A (24%)
Bottom Line
Start (2010 Rate/Hour)
$100.00
$125.00
20.0%
24%
-4.0%
Raise Rate to 2022 CPI (35.4%)
$100.00
$169.25
35.4%
40.9%
35.4%
$44.25
$44.25
24%
16.9%
Minimizing Sales Discounts (5%)
$100.00
$177.71
5.0%
43.7%
42.2%
$8.46
$52.71
24%
19.7%
Minimizing Free Work (5% Billability)
$95.00
$177.71
0.0%
46.5%
42.2%
$0.00
$52.71
24%
22.5%
Minimizing Travel Costs (2% Billability)
$93.10
$177.71
0.0%
47.6%
42.2%
$0.00
$52.71
24%
$23.6%
* Engineer at $120,000 Taxable Wages in 2010 and 2022, billing 1,500 hours to clients, to contracts or to both. $120,000 x 2.5 = $300,000 ÷1,500 = $200/hour @ 50% GM = $100.00/hour COGS. **BIC: “Best-in-Class” – The average SG&A for a services business unit delivering top quartile Net Operating Income percent.
Fifth, Inaccurate Time Tracking by Technical People
Top-performing engineers not only have good technical and problem-solving skills, and good people and customer service skills, they are good company citizens: They produce good documentation, participate well in mentoring, arrive at meetings on-time and prepared, and exhibit high quality time-keeping.
High-quality time-keeping means this:
Eight and one-half hours of time are entered every day, by the end of the day.
The entries are written to be useful to the Finance department, the Sales rep, their manager, and the customer alike.
They are coded correctly.
The importance of timely and correct time entry is on the same level as keeping your foot locker neat and tidy in boot camp – it's basic and can seem dull, and yet somehow getting it right is an indicator of future success. Getting it wrong is the opposite. Steps must be taken to ensure the engineer – of whatever rank and skill – does this properly.
The point of entering 8.5 hours a day is this:
The base pay earned by the engineer is partly to procure 8.5 hours a day; this is the inventory the company is buying from the engineer. Failure to enter 8.5 for the day is failing to properly track inventory, which is tantamount to shrinkage, or stealing.
The point of entering all time by the end of the day is this:
After more than a day, engineers increasingly forget what it was they were doing, and how long it took.
In the face of possibly being untrue to the customer, the engineer will typically shorten the length of time entered for a given task, by a greater amount, the longer the time between task completion and time entry.
They are also more likely to mis-categorize the time entry, and to mis-describe it.
All of which leads to lower billable hours and more inefficiency in the billing and collections process.
If the charge was internal or to a contract, this leads to poor COGS tracking.
Taken together, time tracking which occurs late has approximately this effect on billability and accurate COGS tracking:
Your Time Entry Timeliness Policy
Likely Billability Shrinkage
By End of Month
-8%
By End of Two Weeks
-7%
By End of Week
-3%
By End of Day
0%
As you can see, there is a large improvement in billability when time entries are completed the same day as the work. Even if you are not billing this time (i.e., the time is being accrued to a flat fee contract), the increased accuracy means that COGS is more correctly calculated, which enables effective contract price increases for existing and new contracts.
Keeping Score
Let's assume for score-keeping purposes that you are moving from end-of-week to end-of-day time entry, for a billability savings of 3%.
Actual Realized Rate/Hour
Tactic
COGS Rate in 2022*
Rate/Hour
Step Increase
GM%
%Rate Increase
$/Hr Added to Rate
Cumulative
BIC** SG&A (24%)
Bottom Line
Start (2010 Rate/Hour)
$100.00
$125.00
20.0%
24%
-4.0%
Raise Rate to 2022 CPI (35.4%)
$100.00
$169.25
35.4%
40.9%
35.4%
$44.25
$44.25
24%
16.9%
Minimizing Sales Discounts (5%)
$100.00
$177.71
5.0%
43.7%
42.2%
$8.46
$52.71
24%
19.7%
Minimizing Free Work (5% Billability)
$95.00
$177.71
0.0%
46.5%
42.2%
$0.00
$52.71
24%
22.5%
Minimizing Travel Costs (2% Billability)
$93.10
$177.71
0.0%
47.6%
42.2%
$0.00
$52.71
24%
$23.6%
Timeliness of Time Entry (3% Billability)
$90.31
$177.71
0.0%
49.2%
42.2%
$0.00
$52.71
24%
25.2%
* Engineer at $120,000 Taxable Wages in 2010 and 2022, billing 1,500 hours to clients, to contracts or to both. $120,000 x 2.5 = $300,000 ÷1,500 = $200/hour @ 50% GM = $100.00/hour COGS. **BIC: “Best-in-Class” – The average SG&A for a services business unit delivering top quartile Net Operating Income percent.
Please note that, of the steps we have taken, only two have resulted in actual rate/hour increases to the client; the balance has been internal or external policies and the discipline to follow them.
Sixth, Playing Fair with Emergencies
TSPs often have a personality trait similar to firefighters and other first responders. There is something exciting about being the expert on call who drops everything and rushes out to save the day.
Granted, TSPs are not dealing with medical situations or literal fires (most of the time anyway), but we often respond almost as though we are, often during non-standard work hours. We rationalize this urge for adrenaline and the desire to be the hero by saying we're providing good service. Indeed, we are.
The answer is to define in advance – during the pre-sales cycle – what is good service, and under what conditions.
We can apply a technique originally developed by internal IT departments in large companies to save themselves from being buried under insurmountable piles of “emergencies” – the basic service-level agreement (SLA). TSPs need to apply this to Time and Materials (T&M) work as well as to Managed Services agreements.
The table below provides a basic priority-based billing structure which – if included in each sales presentation and each T&M support or Managed Services agreement (though not billed extra) – will be no surprise to your customers and will cause them to behave rationally when it comes to requesting dispatches. It also recognizes the increased cost you have in bench-time (resource level) to be in a position to meet these response times.
We can apply a technique originally developed by internal IT departments in large companies to save themselves from being buried under insurmountable piles of “emergencies” – the basic Service Level Agreement. Solution Providers often forget this can apply to Time and Materials (T&M) work just as easily – and just as effectively – as it can to Managed Services.
The table below provides a basic priority-based billing structure7 which – if included in each Sales presentation and each T&M support and Managed Services agreement (though not billed extra) – will be no surprise to your customers and will cause them to behave rationally when it comes to requesting dispatches. It also recognizes the increased cost you have in bench-time (resource level) to be in a position to meet these response times.
Priority
Response Time
Definition
Rate per Hour (If T&M SLA)
Rate per Hour (If MSP SLA)
P4
Acknowledged within 8 business hours.
Engaged within 2 business days.
• Could be any task.
Your Standard Rate
Included
P3
Acknowledged within 8 business hours.
Engaged within 1 business day.
• Single user down, workaround available.
Your Standard Rate
Included
P2
Acknowledged within 1 business hour.
Engaged upon acknowledgement.
• Single user down, no workaround available. • Multiple users down, workaround available.
Your Standard Rate plus 25%
• Included during business hours. • If after business hours, $300 per hour.
P1
Acknowledged within 30 minutes during business day, one hour after business hours.
Engaged upon acknowledgement (business or after hours).
• Multiple users down, no workaround. • Executive or Executive Assistant down.
Your Standard Rate plus 50%
• Included during business hours. • If after business hours, $400 per hour rate will apply.
By establishing these expectations in advance, you train the customer to evaluate their need in a realistic light, and you provide yourself with the funding to actually meet your definition of good service and be fairly compensated for it.
There's a reason doctors don't make house calls any more: They want to make a decent wage.
There's another benefit to the tiered-rate approach to response times in T&M contracts: It provides the customer with a financial motivation to consider your flat-fee Managed Services offering (and also, by the way, conditions them to the fact that it to, has a priority-response policy just like this one).
We haven't done actuarial studies of the effects of controlling response times in this way, but experience tells us you'll probably capture 2% to 3% in additional billings, reduce chaos and frustration in your organization worth another few percent.
Keeping Score and the Bottom Line
Let's say that your new tiered response time rate structure results in a mere 1.5% improvement in your realized rates:
Actual Realized Rate/Hour
Tactic
COGS Rate in 2022*
Rate/Hour
Step Increase
GM%
%Rate Increase
$/Hr Added to Rate
Cumulative
BIC** SG&A (24%)
Bottom Line
Start (2010 Rate/Hour)
$100.00
$125.00
20.0%
24%
-4.0%
Raise Rate to 2022 CPI (35.4%)
$100.00
$169.25
35.4%
40.9%
35.4%
$44.25
$44.25
24%
16.9%
Minimizing Sales Discounts (5%)
$100.00
$177.71
5.0%
43.7%
42.2%
$8.46
$52.71
24%
19.7%
Minimizing Free Work (5% Billability)
$95.00
$177.71
0.0%
46.5%
42.2%
$0.00
$52.71
24%
22.5%
Minimizing Travel Costs (2% Billability)
$93.10
$177.71
0.0%
47.6%
42.2%
$0.00
$52.71
24%
$23.6%
Timeliness of Time Entry (3% Billability)
$90.31
$177.71
0.0%
49.2%
42.2%
$0.00
$52.71
24%
25.2%
Tiered Rates by Resp. Time (1.5%)
$90.31
$180.38
1.5%
49.9%
44.3%
$2.67
$55.38
24%
25.9%
Total Improvement
$(9.69)
$55.38
-
29.9%
44.3%
-
$55.38
24%
29.9%
* Engineer at $120,000 Taxable Wages in 2010 and 2022, billing 1,500 hours to clients, to contracts or to both. $120,000 x 2.5 = $300,000 ÷1,500 = $200/hour @ 50% GM = $100.00/hour COGS. **BIC: “Best-in-Class” – The average SG&A for a services business unit delivering top quartile Net Operating Income percent.
We are now well above the Best-in-Class (top quartile) of bottom-line profitability for a Services-Centric operation.
It's important to note that we have both increased rates and reduced the effective or realized COGS. While it is true that the customer will likely have a higher (fairer) bill as a result of both changes, the published rate needed only to go up by 44.6% to get a bottom-line improvement of 6.5 times (25.9% / -4.0% = 6.5x improvement).
This is because we not only raised rates by 44.3% but we also reduced effective COGS by 9.7% ($90.31 / $100.00 = 8.9% improvement).
We should also note that, although our sales commission will have gone up a bit, the effective $55.38 per hour more we are adding in gross margin will have the overall effect of improving our sales-cost-to-gross-margin ratio, because the added gross margin dollars better offset sales base pay.
Gross Margin cures many ills.
Prices Increases for Existing Customers
You've now calculated what your new rates and COGS are.
It's simple enough to increase prices for new customers. However, the above methods must also be applied to existing customers. To do so most quickly and with least loss, follow these steps:
First, categorize your existing customers into five groups:
Category
Description
Action
Sequence
A
Already at your new prices.
None, unless GM% is otherwise low, then diagnose and change.
n/a
B
Not at new prices but will accept them relatively soon, in a fair discussion.
Prioritize by lowest GM% and highest GM$ at stake and take action.
1
C
Not at new prices but will accept the increase, however only at some future point (e.g., the new quarter or year), or with difficulty or delay.
Prioritize by lowest GM% and highest GM$ at stake and take action.
3
D
Not at new prices and GM% is below 30% (i.e. losing money at the bottom line with the SG&A of a well-run service operation) but will accept a price increase with some difficulty or delay.
Prioritize by lowest GM% and highest GM$ at stake and take action.
2
E
Same as “D” but will not accept a price increase.
Terminate as customers in Category A, B, C and D produce additional GM$ and GM% to offset termination.
4
Next, take action with these customers as described in the Action and Sequence columns.
As you do, keep in mind these things:
You will successfully increase services GM$ and GM% across all customers, except a very few. You will likely lose no customers that you don't want to lose; the rest will accept at least some of these increase methods.
This will not appear to be the case early in your services margin increase process. Fear and anxiety will be high, especially among salespeople, who, of those closest to the customer, are often the ones that also feel they have the most “wallet” tied to the outcome.
Salespeople are paid to be persistent and vocal. Even among low-performing reps, their highest abilities can be in internal selling. Meaning, they will often try hard to convince you to avoid carrying out the price increase, or to make it as minimal as possible. If your sales compensation plan is well-crafted, they should be supporting the price increase. Regardless, though, carry it out.
Set a timeframe by which all price increases and policy changes will be in place, for categories “B” through “E” above, period. Manage yourself and the team to it.
Be pleasantly relentless. If a customer will not accept all the steps needed to get to your target gross margin, go halfway now and halfway later.
When you do need to terminate customers, don't attempt to do them all at the same time. Rather, as you add new customers and increase your B, C, and D clients, follow a formula such as for every X number new client added, we will terminate one D or E client.
Our definition of success in raising rates was that we would raise them enough to meet our threshold of 2.5 x Taxable Wages without losing customers we didn't want to lose.
And remember, we only took the mid-point of improvements on most of these items.
Increasing Prices in Managed Services Agreements – Length of Agreement
The length of Managed Services agreements is highly variable. Some TSPs sell month-to-month agreements, while others sell one, two, three, and even five-year agreements. Throughout the industry, there are advocates who feel strongly about the virtues, and pitfalls, of different contract lengths and these advocates will debate the benefits of their chosen model passionately as “religious discussions.” While we don't advocate for a specific length of contract, it is critical to understand the true cost of sale to acquire each new client and how it relates to decisions on required contract length. In addition, should you choose to use multi-year agreements (as we believe most TSPs ultimately will), there are best practices for increasing pricing during the agreement. We'll discuss those later, first we'll discuss the cost of sale.
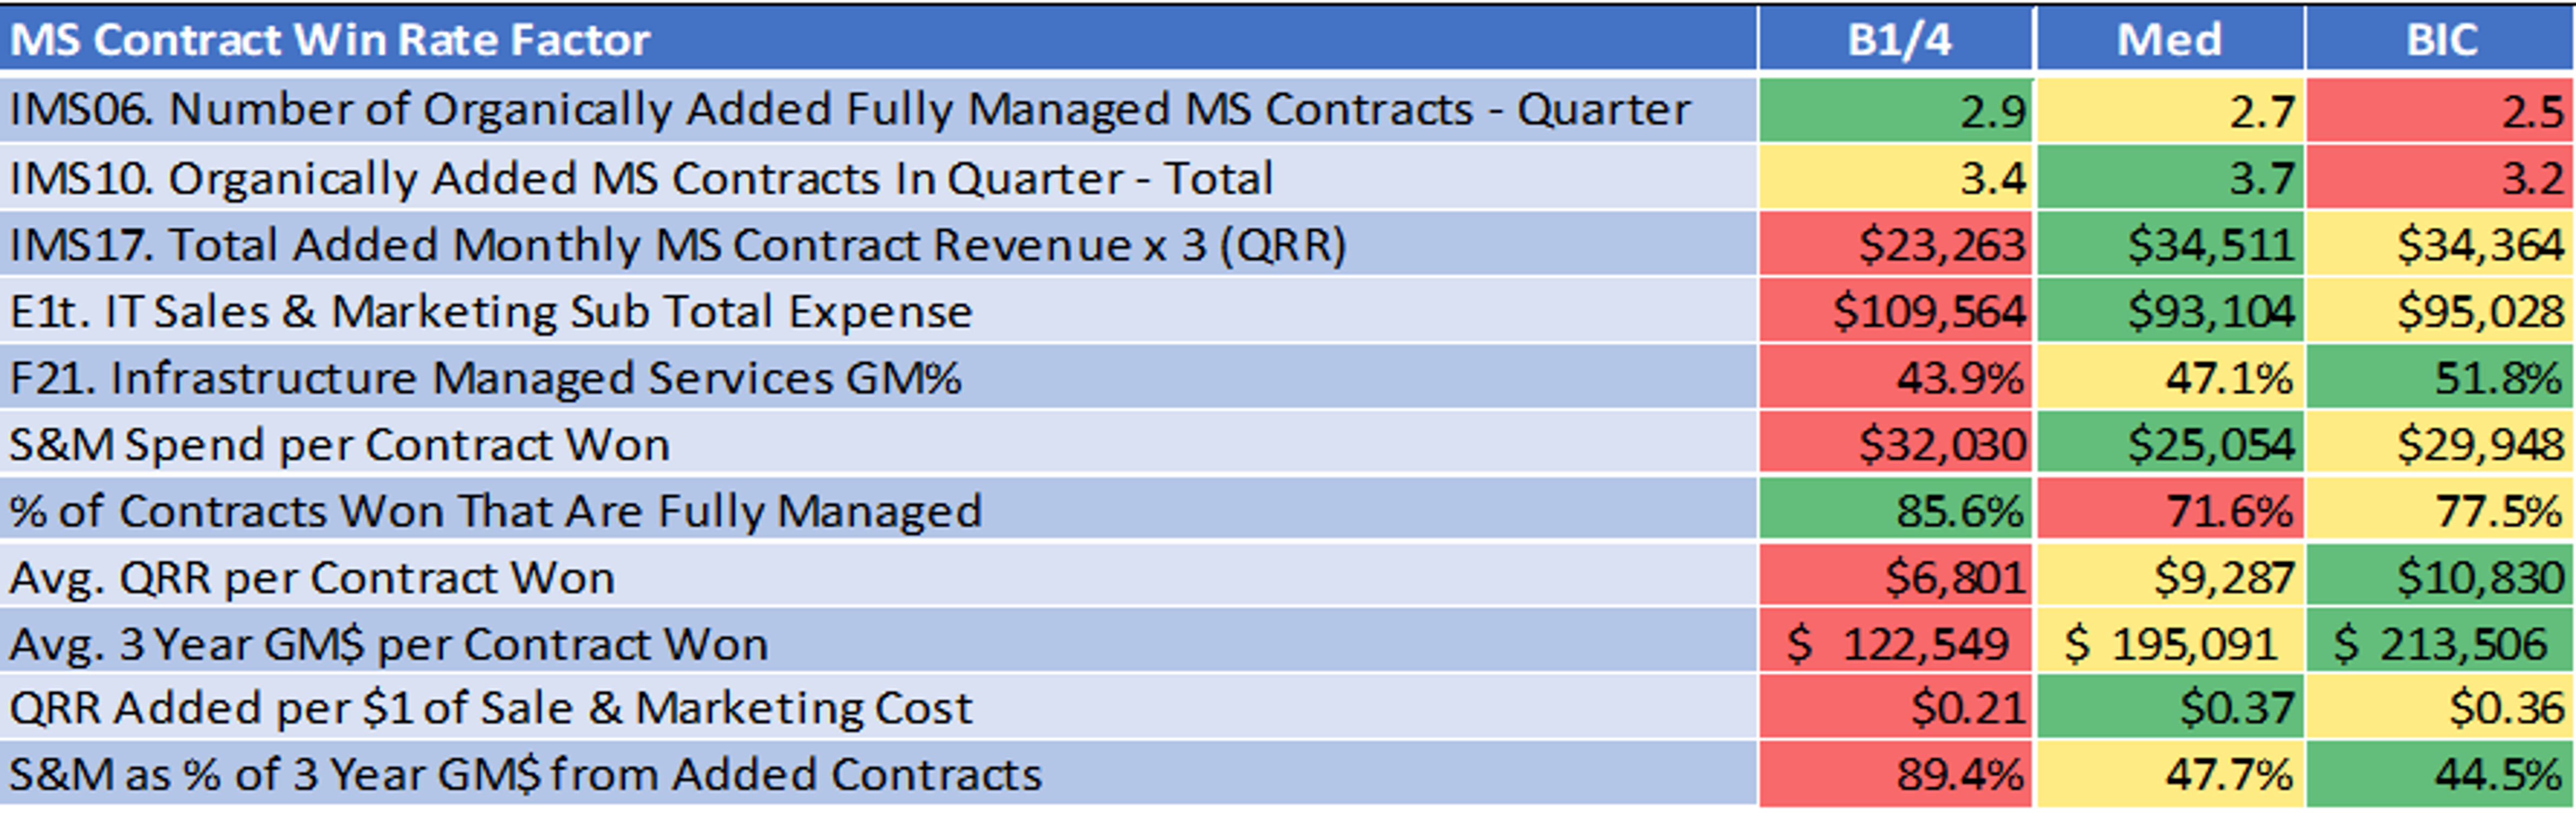
We analyzed the true cost of acquisition to add a new full Managed Services customer. This analysis was over a five-year period, 2017-2021. The math was simple, we looked at how many new agreements were added per quarter, factored in the revenue and services gross margin for those agreements, then determined Sales & Marketing expense per agreement. By determining each of these, we were able to determine, if the customer stayed for three years, how much gross margin would each of those agreements generate and what percentage of gross margin would be used up by Sales & Marketing acquisition expenses.
Source: Service Leadership Index 2022 Annual Solution Provider Industry Profitability Report8
As you can see, the Bottom Quartile performers consume 89.4% of services gross margin on Sales & Marketing expense, Median performers consume 47.7% and top performers (BIC) consume 44.5%. Over three years, this still leaves enough for a healthy profit for the top performers and to a lesser degree, the Median performers, after G&A expenses are paid. But it is easy to see why the Bottom Quartile consistently lose money every quarter. The lessons of this include:
There is no low-cost easy way to add new full Manage Service customers. By the time you add up all Sales & Marketing expenses (including salaries, commissions, and benefits for sales and marketing employees, mileage, websites, marketing campaigns, events, etc.) it is expensive to add a new customer.
The top performers spend much more per customer than the Bottom Quartile, but the customers they are adding are paying much more for equivalent agreements. As a result, their total revenue and gross margin are both significantly higher.
The remaining gross margin shown is based on three years having those customers after sale. If the customer is only with you for one or two years (or, in the case of month-to-month agreements, less than that) the remaining gross margin will decrease to a negative number rapidly, depending on how short the customer engagement is.
Does this analysis prove that all agreements must be three years or longer? Not definitively. There are many providers who use one-year contracts who can demonstrate that their annual customer attrition is low regardless of their shorter agreements and they can document average customer engagements that exceed three years, in some cases by many years. If that is you, we are not telling you to change your agreement length. However, there are many factors that point to why, given the large acquisition cost, providers should consider longer term contracts, such as:
Customers will enter the engagement with an expectation that they will be with you at least the length of the multi-year agreement (i.e., three years). Only customers who are looking for a longer-term relationship will be willing to sign a multi-year agreement. These customers will typically be more willing to listen to suggestions from the provider, and in general, view the relationship as collaborative. By definition, customers who tend to cycle through providers and tend to not be strategic IT buyers, will not enter into longer term agreements.
Onboarding, even when properly executed by the provider, is a complex process and often can be disruptive to the customer. Only after onboarding has been completed can the provider deliver highest quality outcomes to the customer. Because it can take several months to fully complete the onboarding process and initial “cleanup” work on the customer's environment, a longer-term agreement provides greater separation between onboarding and the agreement renewal. That additional time allows the customer a longer time to experience the better parts of the customer experience before having to make a decision whether to renew.
In acquisitions, many buyers will pay a premium for sellers whose customers are on longer term contracts. The reason is that longer term contract provides the buyer with an assurance of revenue from the seller's customers that is more predicable than if the contracts are month-to-month or even one-year.
If your standard contract length is longer than one-year and you find yourself in a negotiation with a prospect who is either unable (due to policy) or unwilling (perhaps due to a poor experience with a prior TSP) to sign a longer-term agreement, and you'd like to figure out a way to still bring that customer on, best practices include:
As discussed earlier, increase the price for the agreement. This will help mitigate your risk on your upfront expenses and conveys a reasonable counter-position to the prospect during negotiations.
Instead of compromising on the length of your agreement, keep the contract length the same, but provide the customer an “early termination” option at the date they are asking. For example, if your standard agreement is three-years and the prospect will only sign a one-year agreement, provide them with a termination agreement after one-year and after that, the agreement becomes a three-year. While that does not achieve all the goals of a longer-term agreement, assuming you deliver a high-quality experience, the customer is unlikely to exercise the early termination and you will be left by month 13 with a three-year agreement.
Increasing Prices in Managed Services Agreements – Price Increase Methodology
If you do use multi-year agreements, those agreements must include price increases throughout the length of the agreement. If they don't, your gross margin will decline annually as inflation sets in, as discussed earlier. In addition, the increase needed at the renewal at the end of the agreement will be much higher than it would have needed to have been had annual increases occurred, due to both the lack of the increases and the power of compounding.
For example: A three-year agreement that increases 5% annually has actually increased 10.25% by the end of the original term. If another 5% is added to the renewal price, that agreement will now have increased 15.75% over the three years. Which increase will be more palatable to your customers at renewal, a 5% increase or a 15.75% increase?
In addition, by effectively increasing prices, you will obtain the benefits of higher profitability and better cash-flow during years two and three.
There are multiple ways that TSPs increase prices within their Managed Services agreements. These are, including analysis of best practices, as follows:
Annual increase tied to CPI – Some providers use the Consumer Price Index (CPI), others use a “CPI+” calculation that adds a %, such as .5-2% on top of CPI. The appeal of this method is that it is easy for salespeople to explain because it is tied to a market-based increase so it seems “more fair” to both the salesperson and the customer. There are two problems with this method. First, it is more complex to implement as it requires someone to track CPI and calculate these increases. As a result, it is more difficult to automate in your PSA. The second issue is that wage inflation and cost of tool inflation for TSPs typically outpaces CPI increases. So, in most years these increases will fail to keep up with your actual inflation and your gross margin will erode after the first year of the agreement as result. In years where there is higher inflation and the CPI comes in higher as a result, many TSPs have also struggled to pass that higher number onto their customers. As a result, in years with low CPI increases, the pricing increases too little and in years with higher CPI increases, pricing increases too little, the worst of both worlds. This method is certainly better than having no increases but proceed with due caution.
The “Up To” Increase – The second method to increase pricing is to include a clause in the agreement that allows you to increase the price “up to” a certain percentage, typically 3-5%. While this method may seem identical to setting an increase percentage, upon closer examination, it is not. The first issue is that it has to be managed annually and potentially by customer. Again, this will make it less efficient to administer. In addition, it rather than settling the issue of what the increase would be at the time of the original agreement negotiation, many customers will view it as an annual negotiation opportunity. As a result, TSPs who use this method frequently end up with lower increases than what they envisioned.
The Set Increase – Top performers will determine an annual increase for their agreements and increase their agreements to that percentage automatically. For example, the contract will include an increase clause, frequently referred to as an “Escalator Clause” that states that upon the anniversary date of the agreement, the price will increase X%. Commonly, that percentage is also 3-5%. By setting the price, the customer enters the engagement knowing what that increase will be and thus will not be surprised when it is implemented at their anniversary date. Thus, it removes the negotiation aspect found in the “Up To” methodology. It also can be set in most PSAs at the time of the contract setup which will automate the process and increase operational efficiency. For all of these reasons, this method is the best practice. One additional “pro tip” on this method is to set the increase such as “4.1%” instead of “4%,” or “4.95%” instead of “5%.” When presented in this way, customers will assume there was more science put into the methodology of determining the increase and are more likely to accept it as legitimate and thus, fair.
If you're agreements do not currently have the length of term of price increase methodology that you would like them to, the faster you change them the quicker they all will. If you start today, and upon renewal you move all of your customers to your newest agreement, you will have moved all of your customers in no time. The longer you wait to get started, the longer this migration will take. As a result, the longer it will take for you to see the benefits of these changes.
Conclusion
Did we lose any customers we didn't want to lose?
Based on years of experience, we can tell you, your concerns about unwanted client attrition are unfounded. Time and again, managers – and especially salespeople – are convinced that some or all of our good customers will simply depart if we hint at changing rates.
Yet, whether the economy is up or down, once the decision is made – and bravely enforced – the troops will fall in line. And they will be astonished to find that all the good customers will stay. They may push back on one point or another, but in general good customers accept that you need to be reasonably profitable. They want you to stay in business, and do a good job, because it's better for them.
Bad customers won't, but you weren't making money on them anyway. Give them your competitor's contact information before you leave.
There's a close correlation to this in the customer satisfaction ratings that you earn. Because many customers pressure us on rates and Managed Services agreement pricing and imply we don't provide great service (what better way to keep us on our toes, rate-wise and otherwise?), we may come to believe that we must be generating poor customer satisfaction.
The facts prove otherwise.
More tellingly, the more profitable the TSP, the more likely the customer satisfaction scores are to also be high. Chicken or egg? How about both!
In short, if you want to generate value like a doctor raise your rates regularly and plug your realization leaks. We've covered only the major ones here; there are dozens more.
Appendix: How the Services Gross Margin Tracking Sheet Works
In this example:
We're using projects (as opposed to Managed Services agreements, but the approach can be used for those as well.)
We've assumed for simplicity that all 20 projects are for the same deliverable – that is, for the install or implementation of the same solution, 20 times.
However, the approach can and should be used for your whole mix of engagements.
The point of here repeating one deliverable 20 times is simply to show more clearly the gross margin progress that is typically made.
Down the left column, you will see the suggested stages for any given offering, from the Alpha stage (first three Sales) through Beta (next three) and then through early production, production and late production, when margins get to plan.
The margin disappointments and recovery are the typical lifecycle of any new solution or service; the names of the stages and how you deal proactively with them are our construct.
First, however, we'll describe the columns:
Columns B through E are what we tell ourselves the COGS, selling price and margin will be.
Columns F through K are what they really turn out to be.
Columns L through R, are analysis for purposes of tracking our progress towards the target gross margin.
Alpha Phase
During the first three sales (the Alpha phase), because the offering is new, we underestimate the COGS, and we are often unsure how to articulate the value.
Expected COGS turns out to be low compared to actual, tallied after the fact.
Likewise, the selling price starts out low, because we don't yet know how to articulate the value and may not even know it ourselves.
This lack of clarity and confidence also leads us to discount the (already too low) selling price by 10% in this example.
As a result, although we are bidding a price in the low 30% gross margin range, by the time we get done with the discount and with the unexpected additional work, our actual gross margin on the first three deals is negative.
Indeed, while pressure on the service manager is causing Bid COGS (column B) to go down, Actual COGS (column H) is increasing with each deal.
This is normal during the Alpha and even Beta phases. On any new solution or service, you don't know what you don't know.
Beta Phase
Clearly, this trend can't continue and management makes an intervention. We look at both Actual COGS (column H) and the COGS trend (column I) and we estimate that the COGS on Project #4 will be 10% higher than on Project #3.
Bid COGS on Project #4 is now nearly double that of Project #3 (but “only” 10% higher than Actual COGS of Project #3), for safety.
In addition, management intervenes on both BID GM% (column E) and Discount Given (column F), such that Project #4 is bid (column C) at nearly double that of Project #3, as is Actual Selling Price (column G).
As a result, Project #4 comes in at 32% Actual GM% (column K) and nearly $10,000 gross margin dollars higher than Project #3 (column J).
Important: we are continually monitoring Actual COGS (column H) and using it to guide our next Bid COGS (column B).
We are on the right track.
Early Production Phase
By the end of the Beta phase, we see our Actual COGS (column H) has stabilized. Actual GM% (column K) has also stabilized. We are gaining confidence that we can estimate and deliver these deals.
After six repetitions, assuming we are using the same group of people and properly managing our knowledge base, we are also delivering better quality: on time, on budget, on specification, with fewer surprises for us and the client. Actual COGS (column H) is in fact beginning to fall slightly.
We have also proven we can sell these deals at much higher prices than when we started out. We know better the value of the offering to the client, the risks they face if they don't go with us, and how to handle objections.
As a result, we are now confident we can raise our Bid GM% (column E) to 40%, even though it means driving the price up a bit. We need to start to recoup our previous losses, and our investments in pre-Sales, training and so on. That said, we are still allowing the Sales reps the discretion of a 5% discount.
Production Phase
After nine repetitions, we see that Actual COGS (column H) is falling nicely. Our team is gaining efficiency and starting to build tools to help them work smarter.
Even with the 5% discount, Actual GM% is getting close to Bid GM%, because the Actual COGS is dropping faster than the Bid COGS.
Quality is getting even better, as is lead generation, qualifying, objection handling and closing.
The Bid Selling Price (column C) and Actual Selling Price (column G) have peaked.
Now we can get serious. Our quality is strong, as are our sales skills. Time to begin harvesting our efforts and make this line of business contribute to the bottom line.
On deals #10 through #14, we continually ramp Bid GM%, and yet, interestingly, because of the falling COGS, we keep the selling price the same.
We also eliminate the discount, which is fine because most salespeople are long past having to discount to close the deal. They prefer the extra margin.
It's important to note that (because our solution and service offering development process is timed right throughout the year) we started our learning curve ahead of our would-be competitors in our market. As a result, although they now have a competitive offering, we're a half-dozen or so deals farther down the curve, so our selling price is lower than theirs while our gross margin is higher!
Late Production Phase
As we push through to the fifteenth deal, we are still driving additional efficiency, although the improvements are not at the same rate as before. Our sales skills are even better, and our quality is flawless: In our market, we are the “go-to” provider.
Now we can really put pressure on our would-be competitors. We can start driving prices down, just as they're at the peak of their COGS inefficiency, and are still struggling with sales skills and service quality.
We can hold 50% gross margin (or even better) and still push the selling price down with each deal. In fact, our Actual GM$ (column L) are declining a bit with each deal, but we don't mind because our sales team is efficient with this offering and so sales cost as a percent of gross margin continues to improve (not shown in this example).
The Late Production phase may go one for a long time, or not. You will terminate the offer when the next best thing comes along, as determined by your solution and service offering development process.
Critical Success Factors
Keep these important factors in mind:
The first and biggest step is to continually monitor Actual COGS (column H) and using it to guide our next Bid COGS (column B).
Top-performing TSPs virtually never take on a new solution or service “because we have a customer who wants it, and we might sell more.” They never add or replace an offer without the intention of selling 20, 30, 50 of them, for reasons that should now be obvious. Without a plan as shown in the table above, you will never get to Best-in-Class margins or quality. And without those, you will never get Best-in-Class revenue growth.
It's important to understand that, in every market, there are low OML TSPs who will under-bid you. They are not magically more efficient than you; they are losing money. They will either raise their prices, go out of business, or sell their company. For more on what to do, see the section above on value-based pricing versus market-based pricing.
This is how the services gross margin tracking sheet works. Build your own version to help protect your margins during the rollout and adoption phases of your new solutions and services.
About Service Leadership, Inc.®, a ConnectWise solution
Service Leadership is dedicated to providing total profit solutions for IT Solution and Service Providers, directly and through industry consultants and global technology vendors. The company publishes the leading vendor-neutral, Solution Provider financial and operational benchmark: Service Leadership Index®. This includes private diagnostic benchmarks for individual Solution Providers and their business coaches and consultants. The company also publishes SLIQ™, the exclusive web application for partner owners and executives to drive financial improvements by confidentially assessing and driving their Operational Maturity Level™.
Service Leadership offers advanced peer groups for Solution Providers of all sizes and business models, as well as executive and industry best practices education and speaking.
Notice: All materials published (electronically or print) by Service Leadership are proprietary and subject to trademark and copyright protections, regardless of where and how it is sourced. The terms and concepts of SLIQ™, Service Leadership Index®, (S-L Index™), Predominant Business Model™ (PBM™), Operational Maturity Level™ (OML™), Normalized Solution Provider Charts of Accounts™ (NSPCoA™), Total Cost of Managed Services™ (TCMS™) and Service Factory™ are proprietary to Service Leadership, Inc. All Rights Reserved.
1 Taxable Wages: In the U.S., W2; in the U.K., P60; in Australia, “Income Statement”; in Canada, T4; in Germany, “Bruttoeinkommen.”
4 GM%: Gross Margin as % of Revenue; SG&A%: Sales, General and Administrative costs as % of Revenue; EBITDA: Earnings Before Interest, Taxes, Depreciation and Amortization as % of Revenue.
5 You should also know, location has little to do with whether “discounting is necessary” to close deals. There are firms at top quartile, median and bottom quartile profitability in every geography. Top quartile pricing in Tier 4 population markets, is remarkably close to top quartile pricing in Tier 1 population markets. The same is true of employee compensation levels.
6 Although in fact the NOC team should be running higher: 3.5 x Taxable Wages or more. First, they should be highly billable due to little travel time and highly sequenced work patterns. Second, their work should be on a flat fee basis, enabling you to invest in efficiency.
7 This is an example only. Your response times and rates should be established taking into account the realities of your situation. Do not commit to any acknowledgement time if you're not reasonably able to provide it.
8 Recognized worldwide as the TSP industry encyclopedia of performance, this annual report provides a wealth of information about the health and viability of the TSP industry. See how the Best-in-Class in your business model (MSP, VAR, etc.) are performing. Learn more here.