A budget is a plan. It is also a test; actually two tests. It is also an enabler.
Eisenhower, perhaps one of the most pragmatic planners of all Presidents said: "In times of war, plans are useless but planning is essential."
Budgeting is two tests. The first is, can you put together an informed and accurate forecast of Revenues, Cost of Goods Sold (COGS) and Operating Expenses (and therefore, bottom line profit)? This in itself requires knowledge of the business, foresight, judgment. The second is, can you run the business to the budget? This is the beginning of mastery level management of a Technology Solution Provider business. It requires method, process, discipline, leadership and tempered risk.
Having a budget is also an enabler. It allows you to:
Feel more confident in your management of the business,
Be better prepared for the unexpected (good or bad),
Better quantify, evaluate and decide on risks and opportunities,
Hold yourself and your people accountable by measuring performance against budget (goal),
Be more likely to actually achieve your company and personal wealth creation goals.
In short, having a budget and working to meet it, is the single most powerful tool in a Technology Solution Provider executive's bag of tricks. We have seen $1mm companies who would not dream of operating without a budget, and $300mm companies who could not understand why one would be useful.
Guess which companies perform best most years?
Goals for a Budget
The primary goal in creating a budget is to engage the team in meeting the rule of "double-A": "Aggressive but Attainable".
Too easy and the budget ceases to have meaning as a measurement of or motivation for team performance. Too hard, and it results in teams "giving up", not believing that the goal is attainable.
Therefore, the budget should test the reasonable limits of Revenue growth and cost management, to result in good growth profit without undue risk of falling short or, having succeeded, over-taxing the team by starving it of resources.
Before digging deeper into the budgeting process, a word here first about growth "versus" profit. The axiom that faster growing Technology Solution Providers must sacrifice profit to attain that growth is easy to prove false. As we have repeatedly experienced first-hand, and as the Service Leadership Index® shows, fast growing Technology Solution Providers are often the most profitable.
This is for two reasons:
First, Technology Solution Provider businesses for the most part, have low fixed asset needs. Meaning, they do not have factories or other large "build it and they will come" types of investments, unless they have data center assets. Thus, the costs associated with rapid growth – that is, billable engineers – are only incurred as the business is won. In fact, because of the typical lag between the sales pipeline and the hiring pipeline, billable utilization is often highest as growth is fastest, resulting in high profits.
Second, leaving aside Product-Centric firms for a moment, service-centric firms generally grow fastest not when sales people are hired (that is, when sales costs go markedly up) but when senior technical talent is moved farther forward in the sales process. While this may result in a small increase in cost due to additional non-billable time, the typical result is more and richer deals won in a given period of time, with better as-delivered margins. Growth with positive profit impact. In Product-Centric firms, the most common growth technique is hiring more sales reps, which is indeed a "build it and they will come" approach. It is frequently unsuccessful, if only because good sales management techniques are not often also applied.
As a result, we often challenge Technology Solution Provider executives when they say low profits are a necessary by-product of a focus on growth. In addition, if profits are depressed for a significant period of time, and growth has not come, then one must of course question the growth strategies.
In most cases, the more effective approach to building value, is to fix the profit model first, then grow. Put another way, attain Best-in-Class profits (around 19% Adjusted EBITDA1 for a Services-Centric firm and 13% for a Product-Centric firm), then invest in growth. We advise this for several reasons:
The proportion of "grow my way to profitability" attempts we have seen work out favorably is small. This is commonly because either the growth does not come, or costs grow faster than Revenue due to lack of management discipline and planning ability.
It is fairly easy for the low-profit executive to fool himself or herself into thinking that the firm's value proposition is an excellent one that simply has not been introduced to enough people. Better to prove that it has value by getting today's clients to pay a win/win price, and selling and delivering within that, to prove that the business model works. It is hard to grow Revenue, but it is harder to create a value proposition and business model that leads to profit. Low-profit executives who choose the growth path first, are generally trying to take the easy way out.
If you're going to sacrifice, say, 4% of EBITDA to support growth strategies, far better to do it from a 19% basis than a 6% basis.
In short, the golden rule here is, "Fix the profit model, then grow."
As a result, we are proponents of "aggressive but attainable" growth but only when accompanied by "aggressive but attainable" profit. Otherwise, we prefer to see moderate growth with great profit.
What is "aggressive but attainable" growth? While small firms can undoubtedly grow faster, 20% to 30% growth for any firm is significant. Above that, we might call hyper-growth. Hyper-growth can be a result of very successful strategy and execution; perhaps 40% of the time this is true. More often, hyper-growth is a result of a transitory condition, such as winning an unusually large or fast-growing client. In this case, hyper-growth is still not bad, as long as: a) it is profitable and b) the proceeds are promptly and effectively deployed to reduce the firm's reliance on the exceptional client or situation.
We can say, then, that unless the economy is flat or shrinking, a growth target of 20% is in the fat part of the bell curve. Fair enough. What is the thoughtful executive to do with that goal?
Obviously, the objective is to meet that growth in Revenue with a lesser growth in COGS and in SG&A (Sales, General and Administrative overhead expenses). Let's take three examples:
20% growth with lesser growth in COGS and SG&A,
20% growth with the same growth in COGS but faster growth in SG&A,
20% growth with faster growth in COGS and SG&A.
In the first case, a 20% growth in Revenue with only 18% growth in COGS and SG&A results in a 25% increase in profit dollars:
P & L
This Year
Next Year Change
Next Year
Revenue
100
20
120
COGS
44
18
52
GM
56
22
68
SG&A
28
18
33
Profit
28
25
35
The firm is increasing its efficiency, presumably from scale and other efforts. SG&A was consuming 50% of GM dollars; it is now consuming only 48.5%.
In the second case, a 20% growth in Revenue with a 20% growth in COGS (i.e., no improvement in delivery efficiency) and a 22% growth in SG&A. This might be termed a mild case of investing in growth while sacrificing profits.
P & L
This Year
Next Year Change
Next Year
Revenue
100
20
120
COGS
44
20
53
GM
56
20
67
SG&A
28
22
34
Profit
28
18
33
In this case, Revenue grew by 20% but profits grew only by 18%. While the pile of profit dollars has indeed grown, SG&A now consumes not 50% of GM but 51%. The executive can feel good that part of the strategy – the easier part – is working but has yet to prove the business model is scalable. More sales at these ratios would result in an unsafe degree of declining profitability.
Now let's look at a case where 20% growth is the objective, but SG&A goes up and delivery costs are likewise not managed properly.
P & L
This Year
Next Year Change
Next Year
Revenue
100
20
120
COGS
44
22
54
GM
56
18
66
SG&A
28
22
34
Profit
28
15
32
In this case, while Revenue did grow 20%, we have profit dollars growing by only 15%, and SG&A now consumes nearly 52% of every GM dollar.
The firm could be said to be "gaining speed but losing altitude". Once again, the executive, having proven the ability to increase Revenues, should hold himself or herself accountable for improved Gross Margin and reduced SG&A costs in the near future.
Note that the "This Year" P&L ratios cited here are good: The firm has Best-in-Class (top quartile) Services Gross Margin and Best-in-Class SG&A. Median Services Gross Margin is around 46% and in the Median firms, SG&A consumes about 80% of that, leaving a profit of 10% or less.
Ten percent profitability provides little safety margin for the mistakes made in the second and third cases above.
This is why it is easy to observe that fixing the profit model first, and then growing, is the safest path of sustained growth in profits.
Preparing for the Budgeting Process
There are a variety of ways to construct a budget for the next year. We'll cover the basic ones here, but be aware that it takes a number of budget cycles (years) to develop a proven methodology for your company.
That's because budgeting benefits from having specific historical information which takes time to build up. Your first few years of building a budget will likely be somewhat frustrating: Each step in the budget process will reveal what data you don't have and will send you out of the budget planning room back to accounting or service operations for more data.
After a few years, though, you'll build up a portfolio of current reports which contain all you need to know for developing your budget, and then much more of your time can be spent on the higher value activities of planning rather than analyzing.
Broadly, the information you need – preferably going back two or three years so you can plot trends – is this:
So that you can see the Revenue associated with each major type of billable utilization.
Revenue by major account, for any accounts which have comprised (or could or should comprise next year) 5% of your total Revenue or more.
So you can prudently plan for budget needs and upside or downside from accounts that are big enough to potentially "body slam" or accelerate your company single-handedly.
To the degree you are Product-Centric, Revenue by major vendor, so that you can include material vendor incentive programs into your plan.
Number of deals each year, for each major Line of Business (again, by NSPCoA).
So you can determine your average deal size by Line of Business and see if it is growing or shrinking.
Your COGS for both Product Resale and Services (by Line of Business)
So you can accurately forecast Gross Margin dollars available to cover forecasted Operating Expenses.
For identification of the number and types of resources you will need to add (and at what times) during the year to support the projected service delivery requirements.
Your SG&A expenses in detail,
So you can see how expenses have been trending in relation to Revenue, to Gross Margin and to each other.
An organization chart, along with the actual and target annual incomes of each of the people, as well as a basic handle on their incentive plans.
So you can understand your labor costs for all populations (sales, technical, management, administrative) going back a few years and project it forward, and account for likely changes in incentive costs as financial performance changes.
As we noted earlier, this is a fair bit of data to collect, and in general it needs to be about 85% accurate or better. If you are doing budgets for the first time, don't try to overkill on accuracy. Take your best shot at collecting the data and start your budget planning.
As you work through the process, you will indeed find yourself needing to pause and refine your view of the historical data, but at that point you will have a better feeling for how accurate you need to be, which helps minimize analysis overkill.
You now have your data at hand, and you're ready to begin the budgeting process.
Constructing a Budget
A budget is a financial plan for a period of time, typically a year, broken into months and quarters. The first time you construct a budget, you will likely find it time consuming and somewhat painful. The process will be new, needed data will not be at hand, assumptions will need to be thought through, gray areas tolerated. However, after two or three rounds of budget construction (that is, two or three years), you will find it considerably easier and an enlightening and productive process in and of itself, setting aside the ongoing management benefits.
The budget has four main inputs:
Current and anticipated new customers and the Revenue from these customers;
The costs to support these customers and secure their Revenue;
Investments unrelated to supporting projected customers during the budget period, but which is necessary to maintain and enhance the competitive position of your business;
The risks associated with 1-3.
The budget construction process therefore is about securing and refining these inputs, in an iterative process, which ultimately make delivering a healthy business over the budget period a more likely outcome:
Projecting the Revenues for the business in the budget period.
Quantifying the costs to secure and support these Revenues – i.e., cost to serve customers you have and the cost to grow your customer base to meet your Revenue projection, resulting in a projection of Gross Margin and overhead costs.
Identifying the investments necessary to maintaining and enhancing your competitive positioning and determining how much you can afford to invest in the budget period.
The difference between Revenues and costs/investments is the hopefully positive cash flow to distribute to owners and/or reinvest in the business.
A budget is not a license to spend; rather it's a detailed plan which must be evaluated against the actual results in the business on an ongoing basis throughout the budget period:
If things are going better than the plan which drove the budget, you might choose to invest more or earlier to accelerate or otherwise improve the capabilities of your business.
If things are not going as well as projected, you will likely need to take a hard look at your budgeted spend an actually spend less, on a go forward basis, in some areas.
Constructing Your Budget, Step by Step
Traditionally, there are two broad approaches to budgeting, as illustrated in Table 1, below.
Approach
Description
Advantages
Limitations
Zero-based
Starts each budget period by assuming a zero spend in every category.
Builds up the budget from there with justification for every potential dollar of spend.
Terrific as a means of eliminating spending due to "that's the way we've always done it".
Forces re-justification of every dollar of spend every budget cycle.
Brings the management team into closer alignment as to goals and objectives.
Arduous process, requiring tremendous commitment from management and the team to do well.
Many areas of spend are, in fact, effectively predicted by prior period's spend.
Incremental
Essentially initiates the budgeting process with last year's spend and then adjusts, roughly with:
Are we going to do more/less this year?
What does that mean for how much we need to spend?
May be less time-consuming than the zero-based approach.
Can allow budgeting to get sloppy, leaving in expenses that are no longer either truly necessary or the highest priority.
Often doesn't fully challenge the team to do their absolute best.
Table 1 - Methods of Constructing a Budget
Service Leadership generally recommends combining these two methods: A hybrid approach which generates a realistic level of scrutiny across all major spending categories with the relative efficiencies of the incremental approach. In particular:
Start with a thorough process for understanding the budget period's expected customer/prospect-based activities and the Revenue which will be generated from serving these prospects and customers;
Document the costs required to secure and serve the expected base of customers;
Identify any investments required to maintain and improve the competitive positioning of the business;
Assess the adequacy of the resulting budget from steps 1-3;
Perform sensitivity analysis to understand how the budget changes and what the key areas of leverage are in the budget; and
Repeat (iterate) steps 1-5 until the proper balance of expected results and acceptable risk is reached.
It may also be useful to use the zero-based method the first time you construct a budget, and then again, every few years or when the business undergoes major change.
Step 1 – Forecast the Revenue from the Expected Base of Customers
Proper budgeting requires accurate Revenue forecasting. Revenue forecasting starts by unambiguously defining the stages of the sales process, end-to-end, appropriate for your company. For example:
Potential Opportunity (10%)
Pain-Solution Qualified (~20%)
End-user Engaged (~30%)
Investment Intention Validated (~50%)
Vendor/Solution Provider Selected (~70%)
Purchase Scope and Time Agreed (80%)
Procurement Process Defined (90%)
Negotiation Completed/Signature (100%)
Once these stages have been defined, assure that movement from stage to stage is clear, unambiguous and ideally milestone based, and if so, progression is automatic on achieving the milestone(s). To gauge what business likely to close, you can choose one of two methods:
Assign probabilities and multiply the Revenue amount by that probability. For example, we suggest that an opportunity can be raised to 80% probability of close if – and only if – you have given the decision-maker a ballpark price and they have subsequently asked for a proposal or Statement of Work (SOW). Then and only then can you write the proposal or SOW. If they have received the SOW and communicated they will approve it (sign it), then you can raise it to 90% likely to close. Once the signed agreement has been received, you can raise it to 100% (closed).
For a more nuanced approach, instead of assigning probabilities, rather measure the historical and trending ratio of prospects moving from one stage to the next along with the time frame(s) of prospects moving from one stage to the next.
You can now prepare an accurate Revenue forecast.
Starting with the current pipeline, have your Sales & Marketing team commit to loading the front end of the pipeline – this will be a function of how much budget you give them and their historical performance in turning marketing spend into qualified prospects (number and average size). We recognize that many Technology Solution Providers may not have marketing staff or salespeople; perhaps just the owner(s) is (are) doing sales. Marketing may likewise just be word of mouth. Nonetheless you need to start with a commitment to put qualified prospective customers (including additional work at your installed base of customers) into the front end of your pipeline.
Using the historical time frames and conversion ratios from one stage of the sales pipeline to another (and you may need to estimate these ratios until you have enough history to accurately measure your performance) you can then see how much business is likely to move through the sales stages all the way through to the final stage of the sales process (e.g., viii above). What will result is a Revenue forecast, by month of:
Number of new Managed Services (MS) Accounts and the average Monthly Recurring Revenue (MRR) per account,
Projected changes to the installed base of MS clients, turnover, changes in MRR, etc.,
Number of new Time & Materials (T&M Accounts) and the average monthly T&M hours and dollars,
Number of new projects and the average project hours and dollars,
Dollars of Product Resale and committed Gross Margin % on each dollar of product Revenue.
Obviously doing this for every opportunity in every account is not practical. Most Technology Solution Providers find that their top ten customers produce about 50% of their Revenue; a new large client may bump that higher, and it's not unusual (though it is undesirable) to find the largest account delivering 20% or more of the company's total Revenue. While a key goal is obviously reducing dependence on any given account, in the budgeting process it is critical to plan in most detail in those large accounts and prospective new large accounts which are known going into the budget year.
To do this:
Start with your largest account (and/or your largest potential new account) and your largest secured (already contracted) and potential opportunities (deals) within them.
List out the individual deals, and in which month the Revenue is likely to occur. For MRR accounts, there will be a Revenue entry in every month. Projects may or may not span multiple months. T&M services and product sales are more transactional, but usually a run-rate can be inferred.
Assign a probability to each, using the strict guidelines for 80% and higher, noted above. Remember, a significant number of accounts and deals will have low and moderate probabilities, if you are doing a good job of driving a pipeline of business.
You now have your "large account" Revenue plan.
For those accounts and opportunities that are too small to merit individual analysis, it's often sufficient to simply calculate the average Revenue per account or deal (by line of business) per month and multiply that by the expected number of current (won) and prospective new accounts or deals. Apply a reasonable spread of low probability and high probability deals to arrive at a reasonable pipeline.
(This method will require you to estimate how many new accounts and new deals you will win. This in turn should inform your estimation of sales and marketing spend: how many marketing "impressions" and how many sales calls will it take, to generate that number of deals?)
You now have your "not large accounts" Revenue plan.
With these two Revenue plans in hand, you actually have three views of your Revenue potential:
All the opportunities in the pipeline, at their face value (that is, the price you quoted or expect to close the deal at). Call this your "Unweighted" Revenue forecast.
All the opportunities in the pipeline, at their weighted value (that is, the quoted price times the probability of closure). Call this your "Weighted" Revenue forecast.
"Booked" business (that is, your deals at 90% or 100% probability of closure). Call this your "Booked" Revenue forecast.
Obviously, at the beginning of the year, your "Booked" business is not going to be sufficient to run the company profitably, assuming you are expecting to invest in growth. You can then look at your Weighted and Unweighted Revenue forecast to determine where you should set your Revenue budget for the year.
Revenue plan in hand, you can now budget to that plan.
Step 2 - Document the Costs Required to Secure and Serve the Expected Base of Customers
Next you need to assess the costs associated with managing the book of business that you are expecting for the budget period. Using last year's spend by area, ask your managers to prepare a draft expense budget to secure and serve the expected base of customers.
Two broad categories of cost:
People related costs. Salaries, payroll added costs (benefits, payroll taxes etc.), costs of training, travel, related expenses, costs to equip each employee with technology (devices and software), other reimbursed or direct costs for items such as cars.
Non-People related costs – facilities, telecommunications (telephony, broadband, 3rd party professional services costs (legal, accounting, payroll).
Your operational managers should be able to give you a rough activity-based analysis of their staffing requirements.
Line of Business
Drivers of Staffing Levels
Additional Factors
Managed Services
Estimated level of activity across the NOC, Help Desk and Service Desk
Estimated effective capacity utilization for average MS deployed engineer/technician
Resulting staffing
Training
Pay raises
Investments in hardware/software and other capabilities
T&M
Estimated T&M hours
Estimated effective capacity utilization for average T&M deployed engineer/technician
Resulting staffing
Projects
Required capabilities to execute the projects: mix and volume
Volume of project activity by function – e.g., design, implementation etc.
Estimated Projects hours
Estimated effective capacity utilization for average projected deployed engineer/technician
Resulting staffing
Product Sales
Estimated level of activity to support projected product sales: presales, procurement, post-sales
Resulting staffing
Sales staffing and their projected expenses must be correlation to their projected, and committed, Gross Margin dollar growth (not one for one) due to projected sales commissions and their overall total loaded costs. Remember you pay the sales team out of Gross Margin, so they need to commit to not only a Revenue number but a Gross Margin contribution to the business. The Service Leadership Index tracks Technology Solution Provider expenses by category: total sales across all Predominate Business Models™ (PBM™) run an average of about 20.0% as a percent of Gross Margin, for median performing Technology Solution Providers.2
General and Administrative (G&A) costs tend to be largely fixed, but plan for additional headcount as needed based on activities driven by any anticipated growth, such as increased volume of activity in finance to: more contracts, higher billing activity, increased receivables management and more payroll to be managed. G&A tends to run at about 60.0% of Gross Margin dollars for median performing Technology Solution Providers.
Step 3 - Identify Any Investments Required to Maintain and Improve the Competitive Positioning of the Business
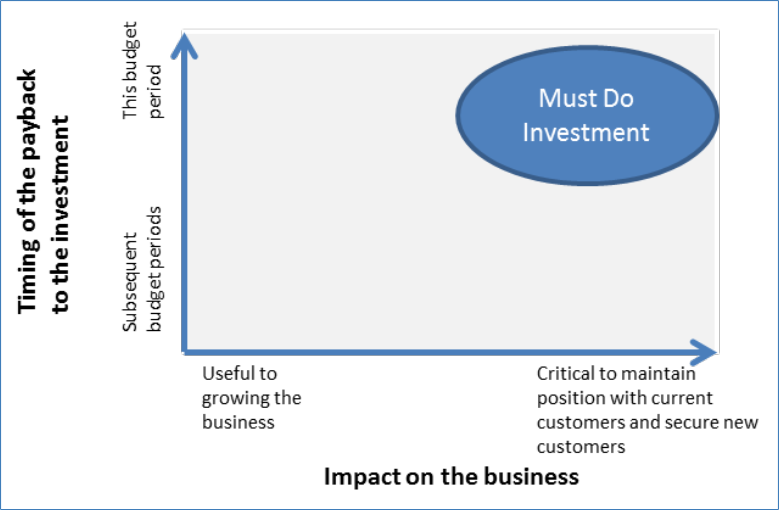
You and your team also need to go through a planning exercise around what are you trying to accomplish this year? Specifically, what are the 3-5 "must do" objectives of your company? Then drive these "must do" objectives down to every part of the organization. What does each part of the company, indeed each staff member need to do to help the organization achieve each of these must do objectives?
Coming out of this exercise with be a series of investments, which need to be categorized and prioritized, for example:
Figure 1 - Establishing investment priorities
Budget and track these investments separately.
Step 4 - Assess the Adequacy of the Resulting Budget from 1–3
You and your team will then take the inputs from 1-3 and assemble them into a first pass budget. Leadership needs to then sit down with each manager and his team and review their initial budget. As a rule of thumb costs always go up. This is human nature: in a growing business we need to do more so it's natural to think we need more to do more.
A critical part of the annual budget cycle therefore is to ask your teams to do more, with less. This might take investment to achieve but it's a critical exercise to engage in annually to protect and grow margins.
For example, if your Managed Services team has a NOC staff to client ratio of X, what would it take to improve that ratio by 25% this year? By 50%?
What are the underlying policies, procedures, controls, business processes, systems, management, and culture that drive the cost in each area? What can be done to streamline and improve overall efficiency and performance with the same (or less) resources). The Best-in-Class Technology Solution Providers are always examining their businesses to improve their performance and drive margin.
Ask each manager to go back, after these conversations and prepare a revised budget, which may actually call for additional investment.
Step 5 - Perform Sensitivity Analysis to Understand How the Budget Changes and What the Key Areas of Leverage Are in the Budget
A critical part of the budget is to understand what the key assumptions and drivers of the budget are and then to test the sensitivity of the budget to changes in these critical assumptions. Generally speaking, the main points of leverage in the budget include:
New Revenue – close rates on proposals, pace of acquiring new customers, realized pricing (MRR, project size etc.), realized hours, etc.
Revenue associated with current customers – retention, ability to effect pricing changes,
Required staffing to secure the new Revenue – sales force effectiveness, anticipated turnover, ability to hire and train new staff, etc.
Required staffing to support the projected book of business – performance to expectations, actual vs billable hours, required vs bid rates, etc.
Ability to execute planned investments - impact of delays and cost overruns on the Revenue plan and budget.
Step 6 - Iterate the Budget Until the Proper Balance of Expected Results and Acceptable Risk Is Reached, and Put It into Action
This is an iterative process. Usually there is difficult but healthy give-and-take during the iteration process. You decide to invest and make less profit. You decide to invest less to make more in the short term, but recognize that this comes with some risk.
Each Technology Solution Provider also needs to factor in its own tolerance for risk in finalizing the budget for the year. If a slight miss means you can't pay your mortgage, then redo the plan till you are comfortable you can survive and be in a position to thrive.
Finalize the budget; this doesn't mean the managers get to simply spend. Budget isn't spending authority, it's just a ceiling. Management still needs to assure that every decision to spend of significance is inspected and approved prior to final commitment because often things will change during the year and each specific spend may no longer be appropriate. This is especially true of new personnel.
Your last step is to put the budget into action. Technically, this means entering into the budgeting portion of your accounting system (assuming it has one). This is followed by reporting each month and quarter not just on results, but on the degree to which you met or beat the budget:
More or less Revenue than planned, and of which type and which customers?
More or less COGS than planned, and of which type and which customers?
More or less Gross Margin (dollars and percentages) than planned, and from where?
More or less overhead expense (dollars and percentages) than planned, and of which type?
More or less profit (dollars and percentages) than planned, and from where?
As you become accustomed to reviewing these "budget vs. actual" reports, you will find your ability to run the business effectively, and make prudent but assertive plans, is significantly increased.
Interestingly, Product-Centric firms are most likely to incentivize management with a simple profit-sharing plan: "You each get 5% of profit at the end of the year." This often fails to produce profit-oriented behavior among managers, especially in lean years. This is because managers by nature do not fully think like owners, nor do they have as much at fundamental risk as do owners. So they are more likely to lobby to have high base salaries (as a proportion of total pay) and set their income expectations on their base salaries and view profit-sharing as a "nice to have."
By establishing a budget which projects a given level of profit, management incentives can then be placed on the degree to which that profit is attained. This should be combined with meaningful incentives: between 20% and 40% of the managers' total pay should be based on hitting the budgeted profit targets. Instead of sharing out whatever profit is achieved, managers don't receive their incentive pay, in part, in whole or more, unless and until profit targets are approached, attained or exceeded, respectively.
As you can see from just this example of management incentive pay, constructing a budget and running the company against it, is a powerful tool for consistent, sequential success in the Technology Solution Provider business.
Firms that budget effectively, and manage their business by that budget, more often reach their Value Creation goals, than do those that do not.
About Service Leadership, Inc.®, a ConnectWise solution
Service Leadership is dedicated to providing total profit solutions for IT Solution and Service Providers, directly and through industry consultants and global technology vendors. The company publishes the leading vendor-neutral, Solution Provider financial and operational benchmark: Service Leadership Index®. This includes private diagnostic benchmarks for individual Solution Providers and their business coaches and consultants. The company also publishes SLIQ™, the exclusive web application for partner owners and executives to drive financial improvements by confidentially assessing and driving their Operational Maturity Level™.
Service Leadership offers advanced peer groups for Solution Providers of all sizes and business models, and individual management consulting engagements for Solution Providers from US$15mm to US$3bb in size worldwide. In addition, Service Leadership provides global IT vendors with advanced partner enablement assets, partner ROI models, management consulting and advanced peer groups, as well as executive and industry best practices education and speaking.
Notice: All materials published (electronically or print) by Service Leadership are proprietary and subject to trademark and copyright protections, regardless of where and how it is sourced. The terms and concepts of SLIQ™, Service Leadership Index®, (S-L Index™), Predominant Business Model™ (PBM™), Operational Maturity Level™ (OML™), Normalized Solution Provider Charts of Accounts™ (NSPCoA™), Total Cost of Managed Services™ (TCMS™) and Service Factory™ are proprietary to Service Leadership, Inc. All Rights Reserved.
1Earnings Before Interest, Taxes, Depreciation and Amortization, and after owner fair market compensation from the Income Statement (not Balance Sheet).
2If you benchmark with Service Leadership, please see your S-L Index™ Quarterly Benchmark Report Book™ and Best-in-Class-o-Meter™ for specific Best-in-Class ratios for your PBM.