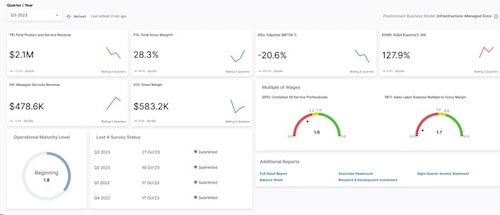
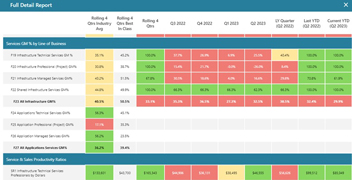
The confidential Service Leadership Index benchmarking web app provides instant access to 80+ key metrics along with multiple charts and reports for deep dive analysis and action.
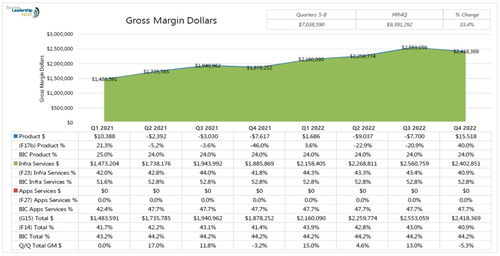
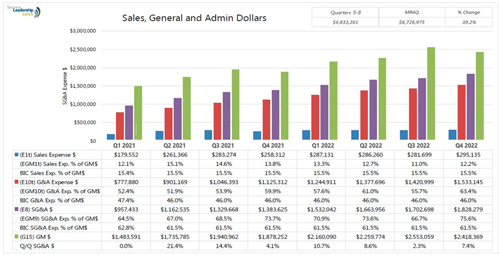
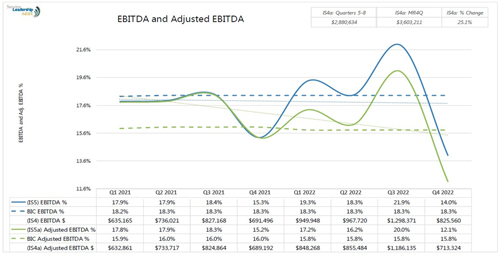
Each quarter, you are benchmarked against:
- Your own previous quarters and year/year
- Industry average (across all IT solution provider business models)
- Best-in-class (those in the top quartile of profitability in your specific IT solution provider business model)
See at a glance how your company is financially performing, and how you compare to the top performers in your business model each quarter to determine where improvements need to be made.
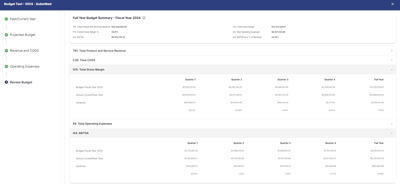
Exclusively in the Service Leadership Index: The Service Leadership Index® Budgeting Proforma Tool™ helps you set upcoming financial goals, and guides you step-by-step in creating a detailed revenue, COGS, and operating expense budget.
Get Started
Sample Quarterly Benchmarking Charts